Effectieve verklarende grafieken
Introductie tot datavisualisatie met ggplot2

Rick Scavetta
Founder, Scavetta Academy
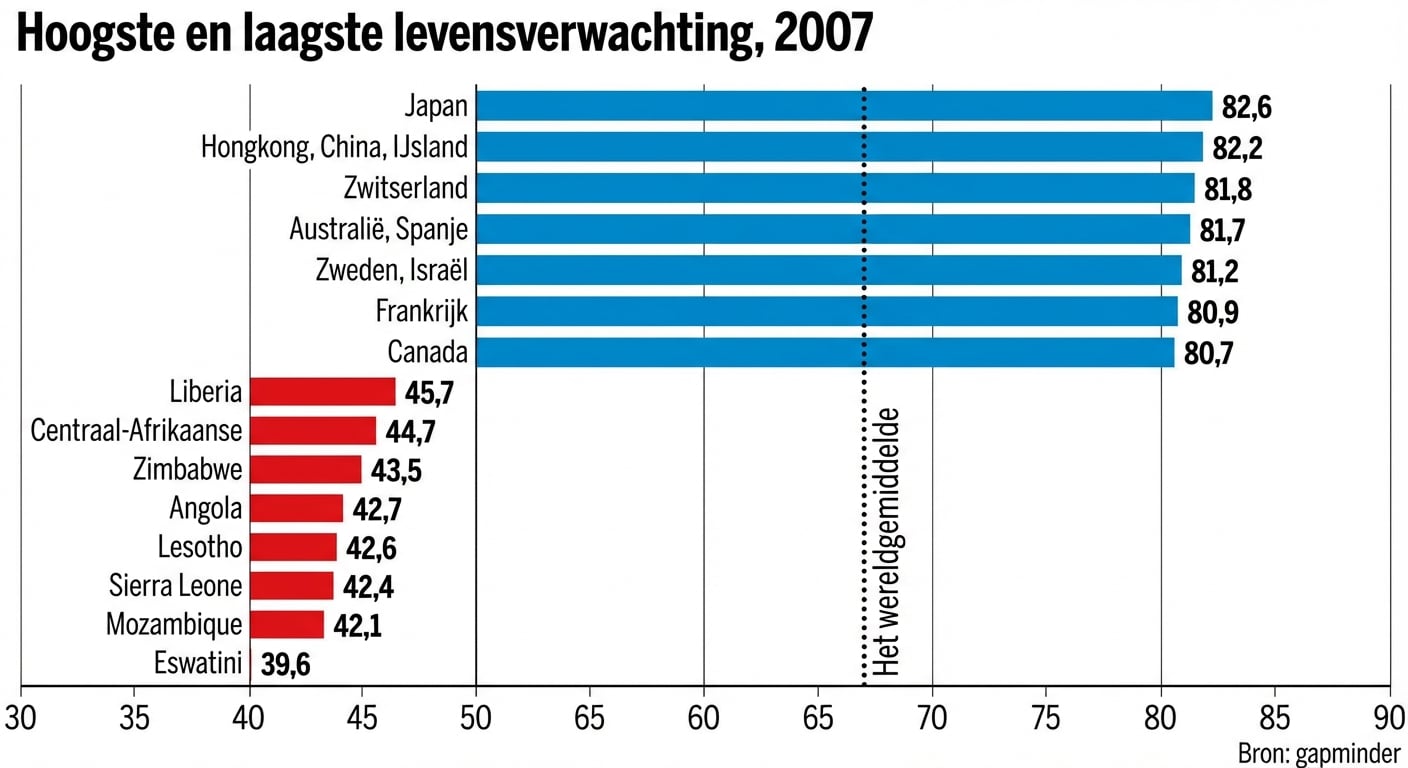
Ons doel: een effectieve verklarende grafiek
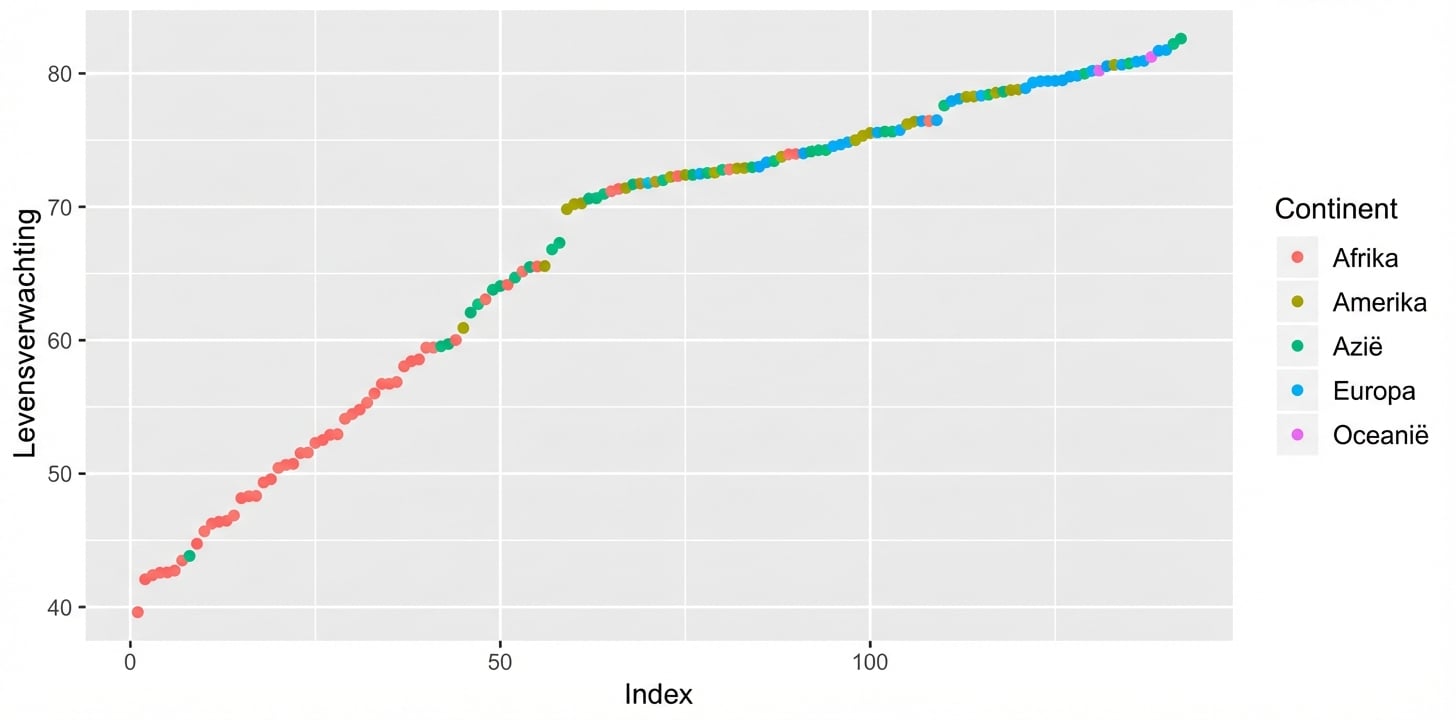
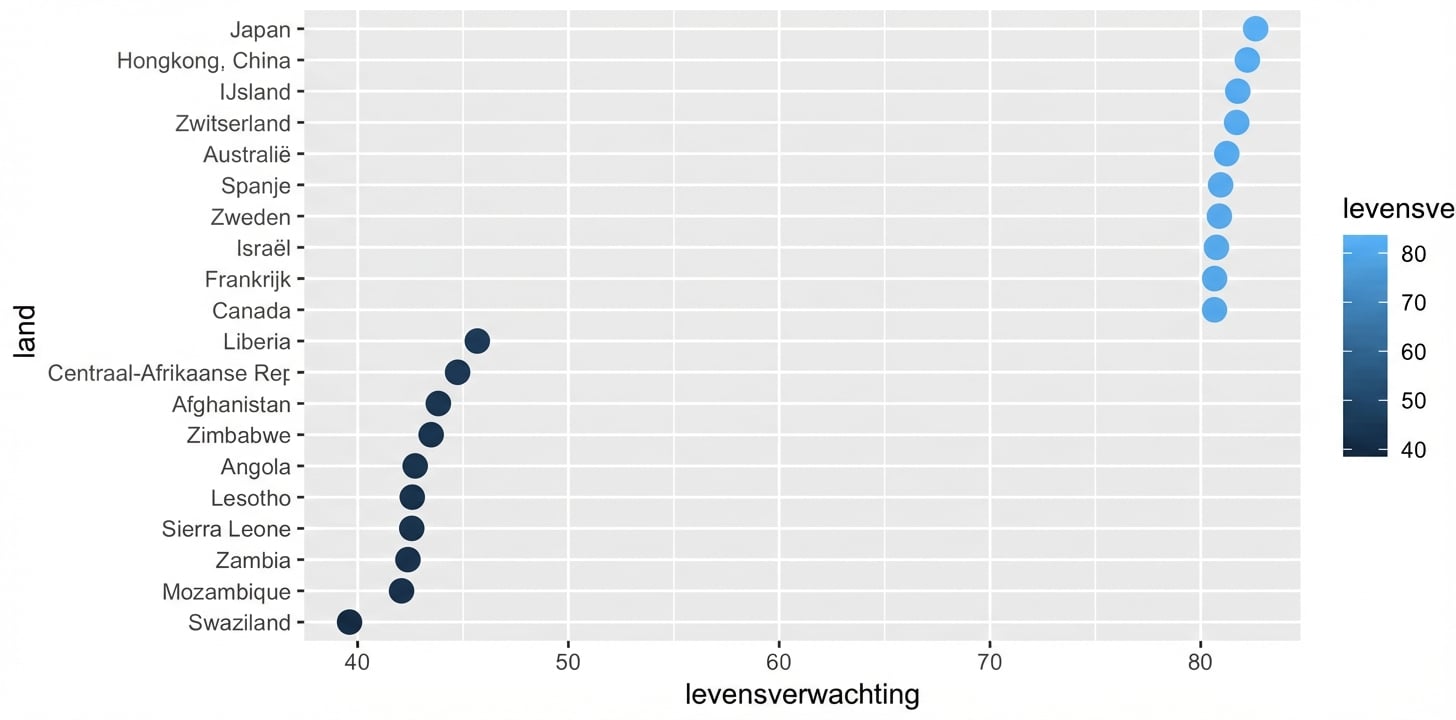
Eerste verkennende grafieken - verdelingen
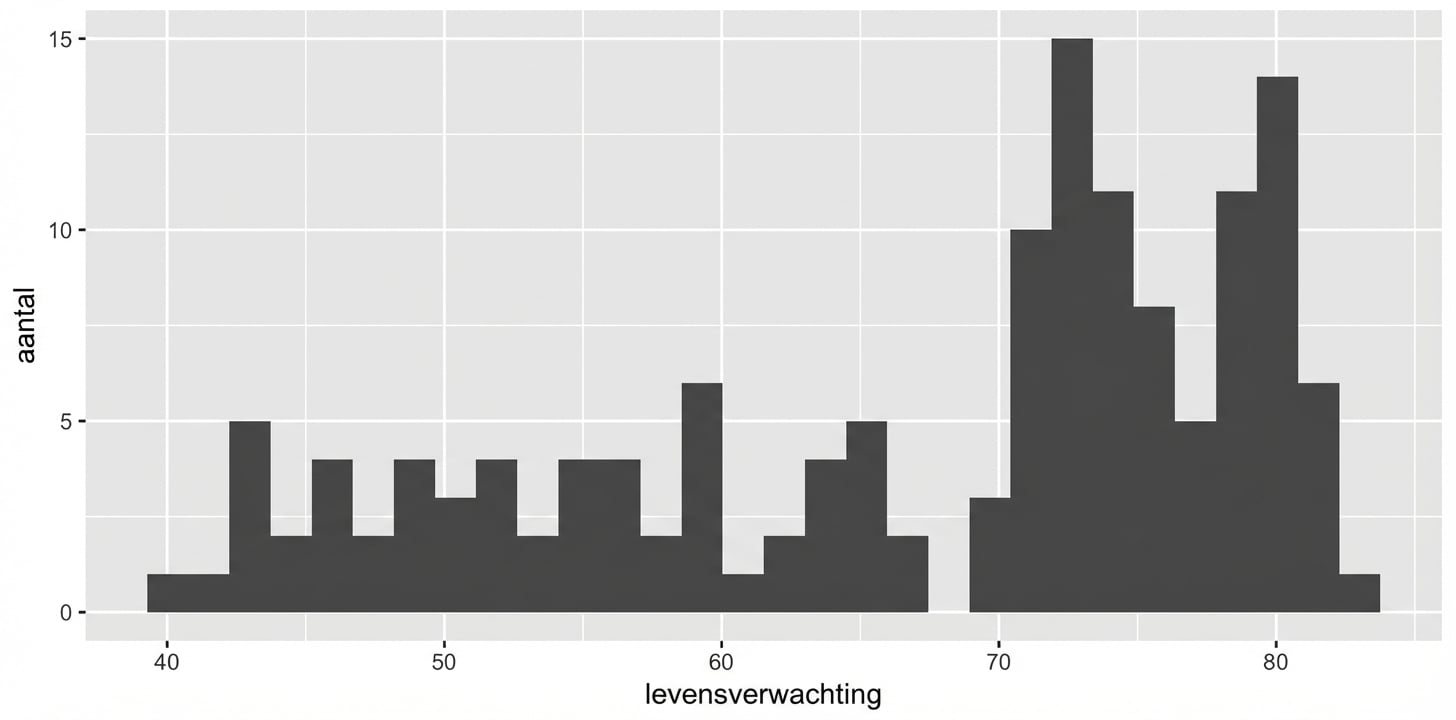
Eerste verkennende grafieken - verdelingen
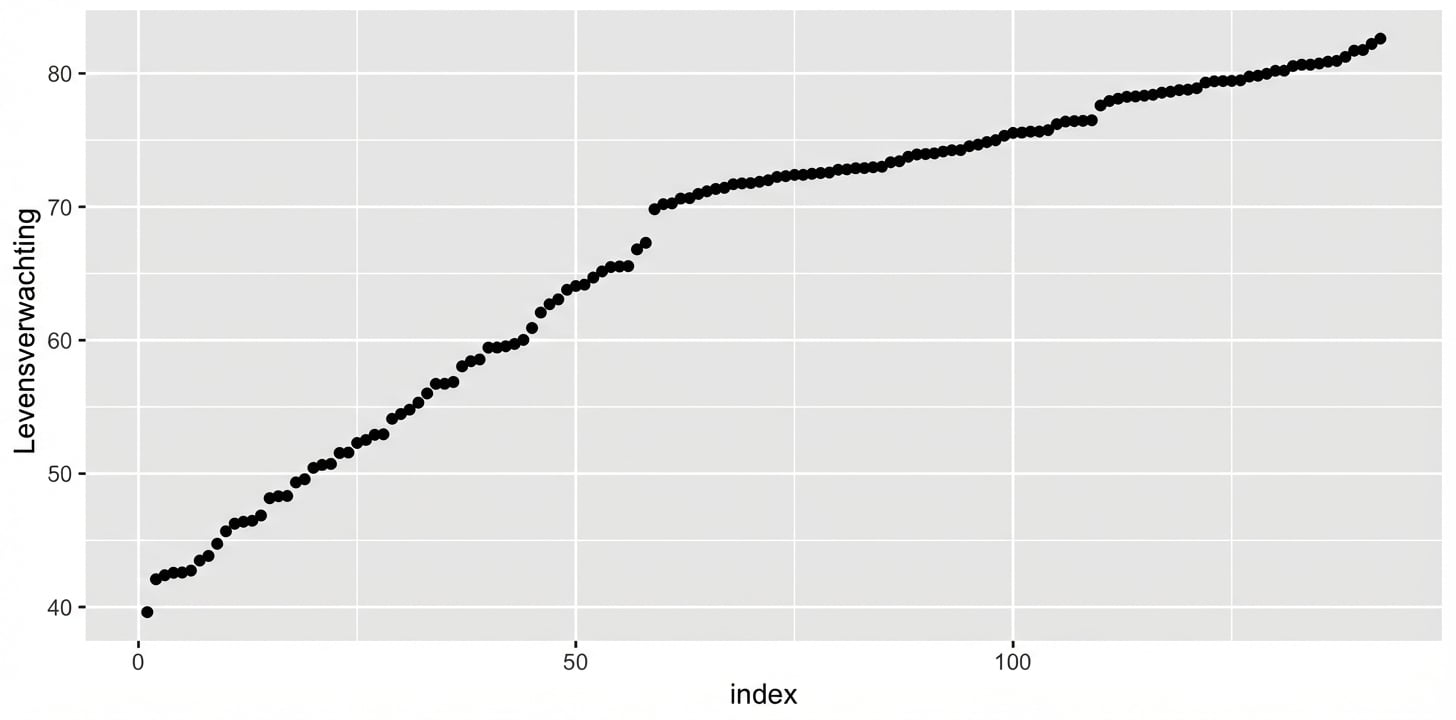
Eerste verkennende grafieken - verdelingen
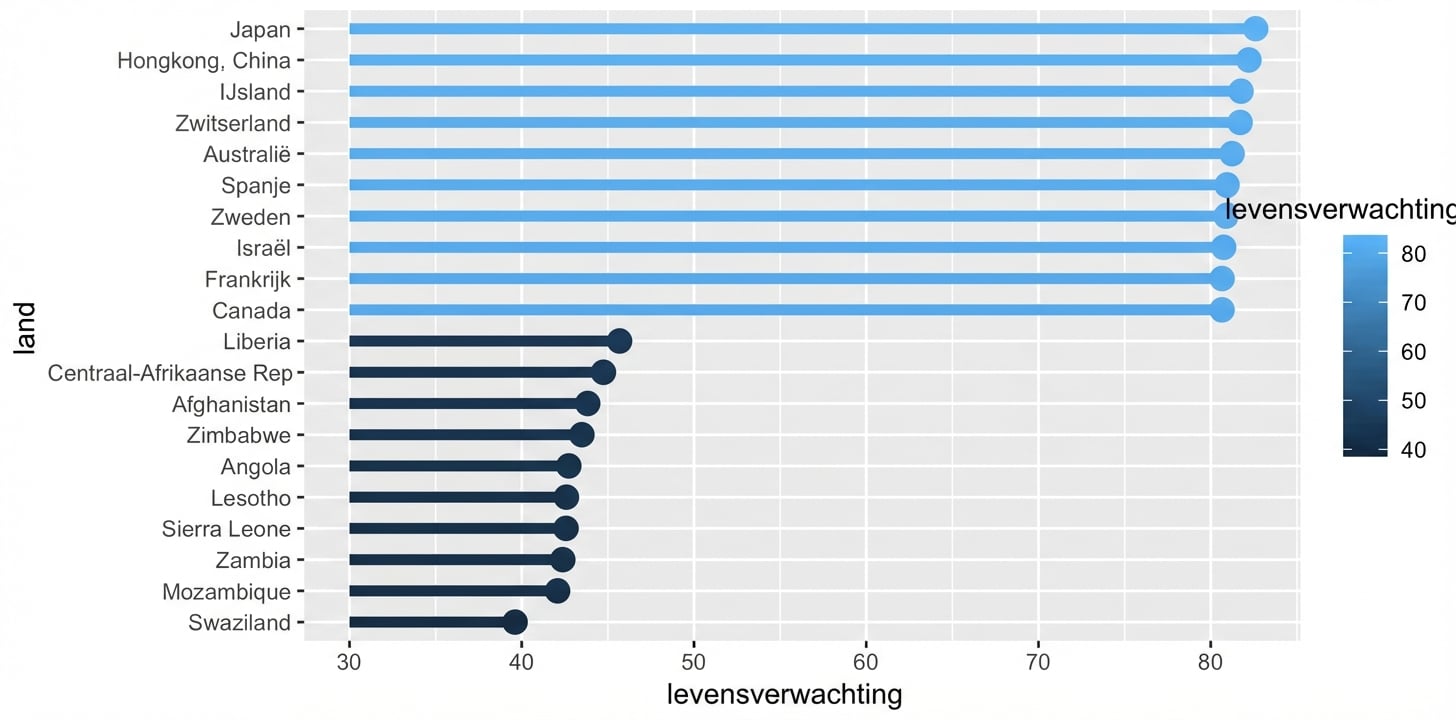
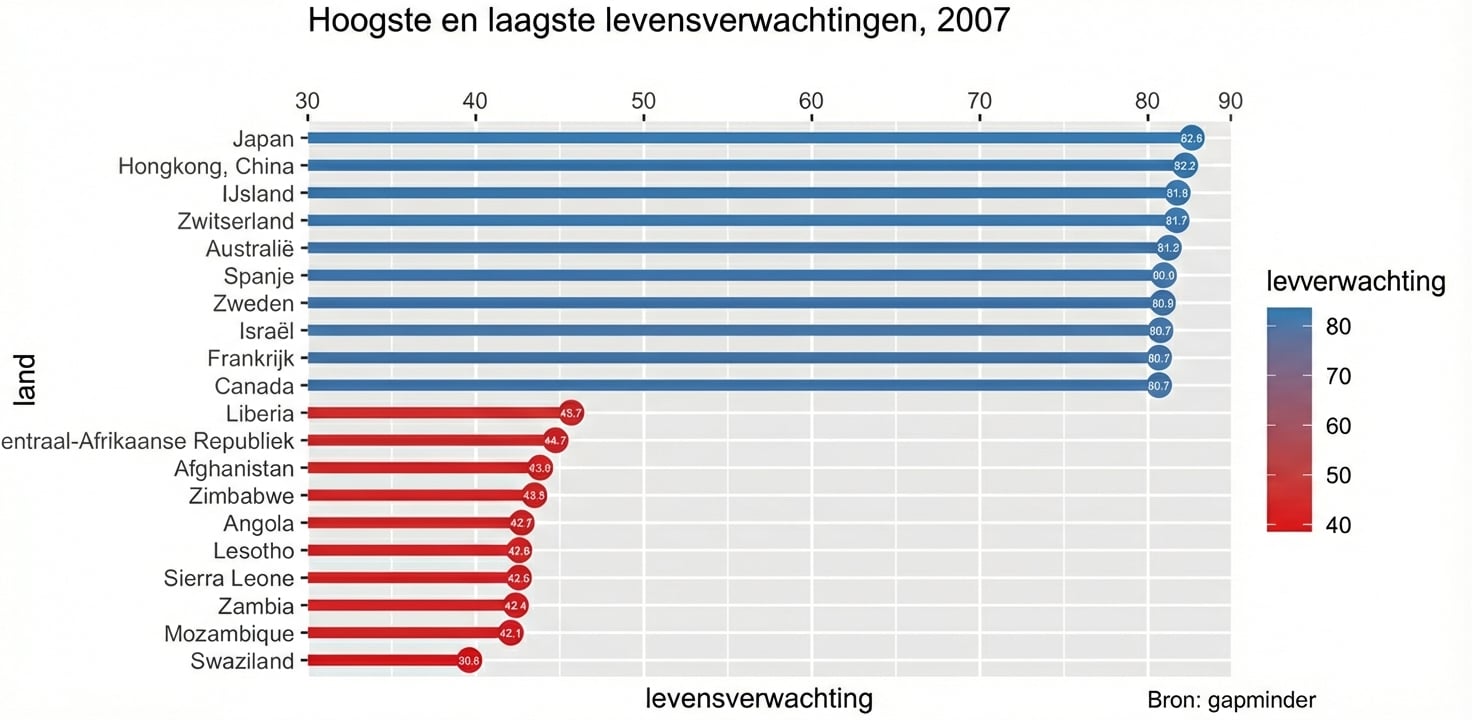
Gebruik intuïtieve en aantrekkelijke geoms
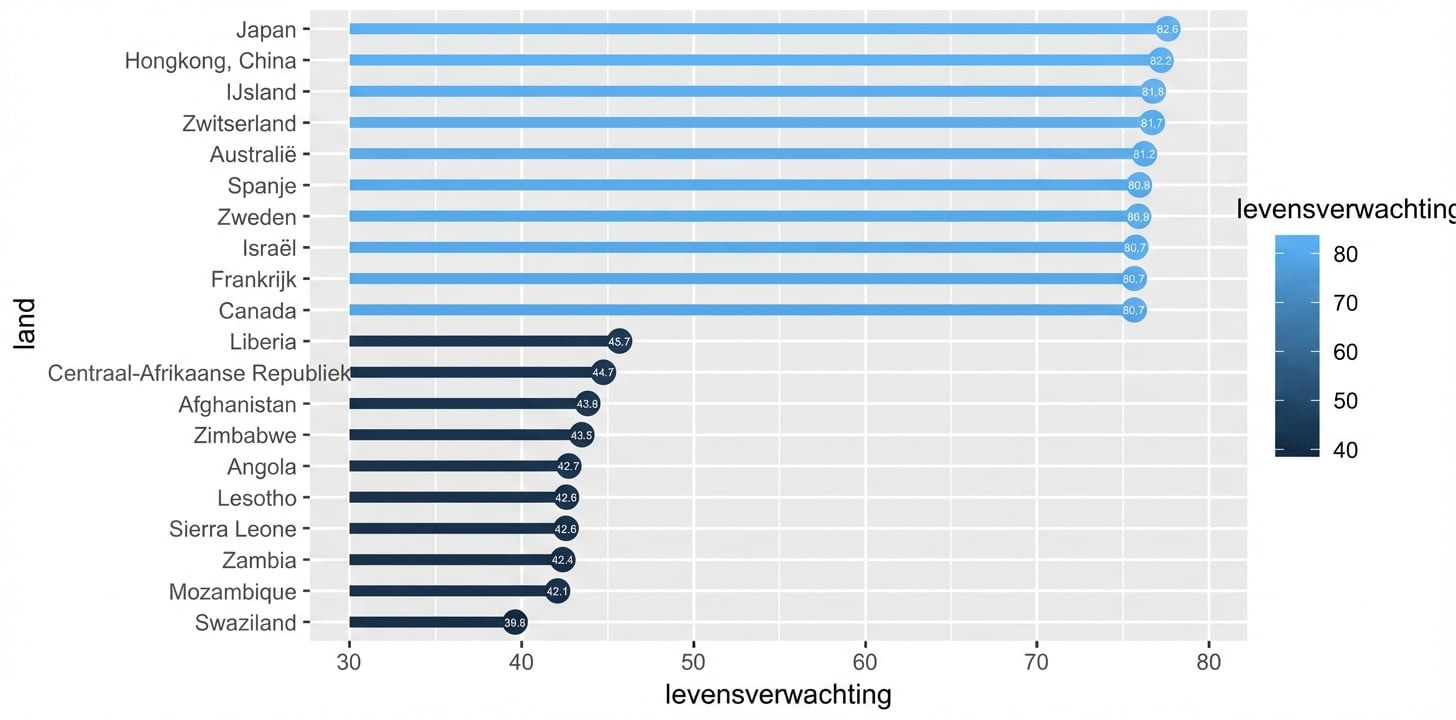
Voeg tekstlabels toe aan je grafiek
Gebruik passende schalen
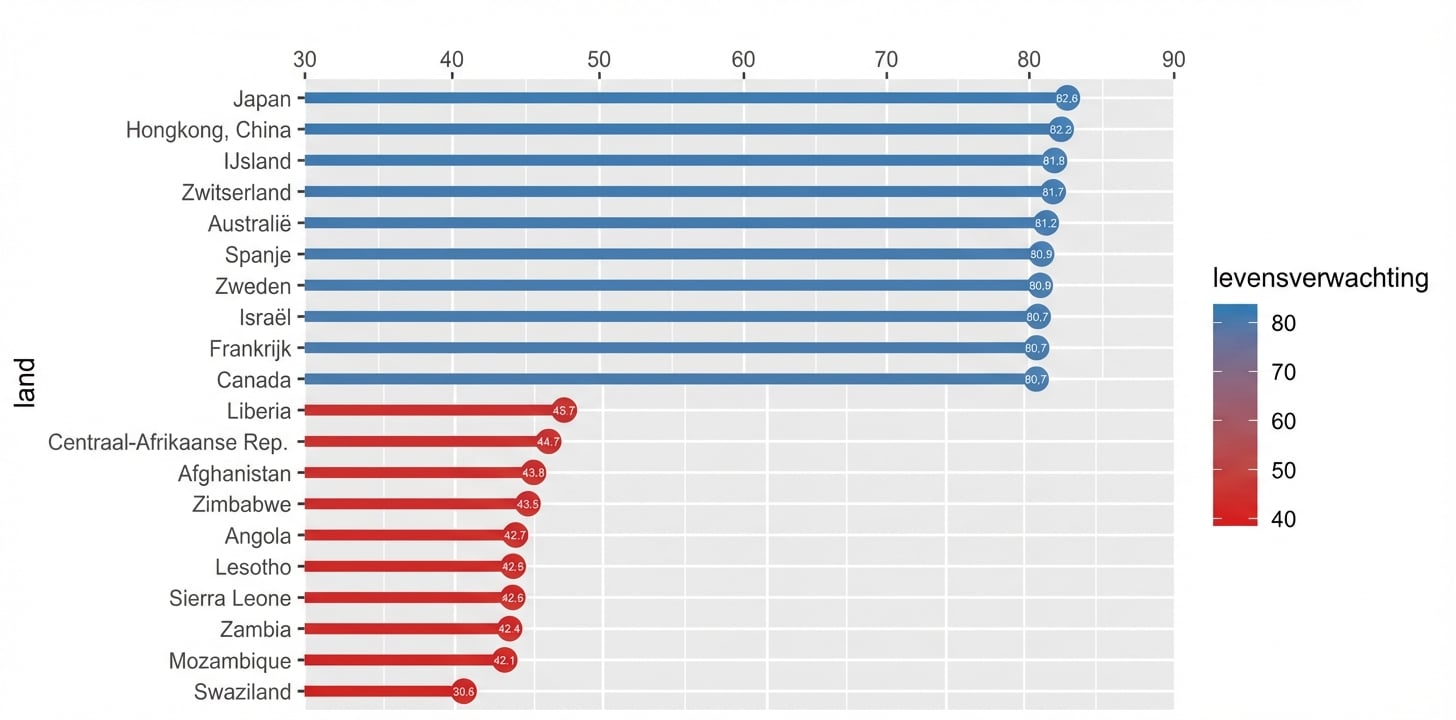
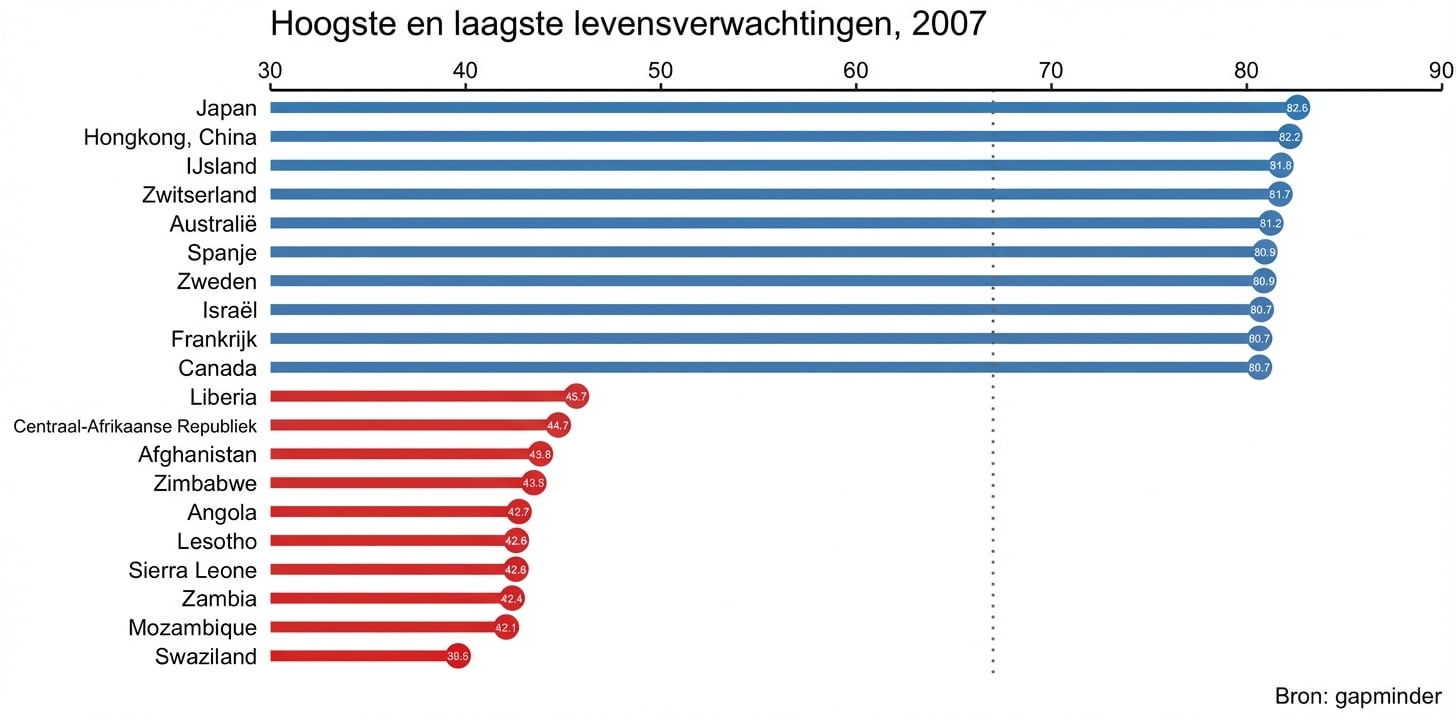
Voeg nuttige titels en bronvermeldingen toe
Verwijder niet-data-inkt

Voeg drempellijnen toe
Voeg informatieve tekst toe
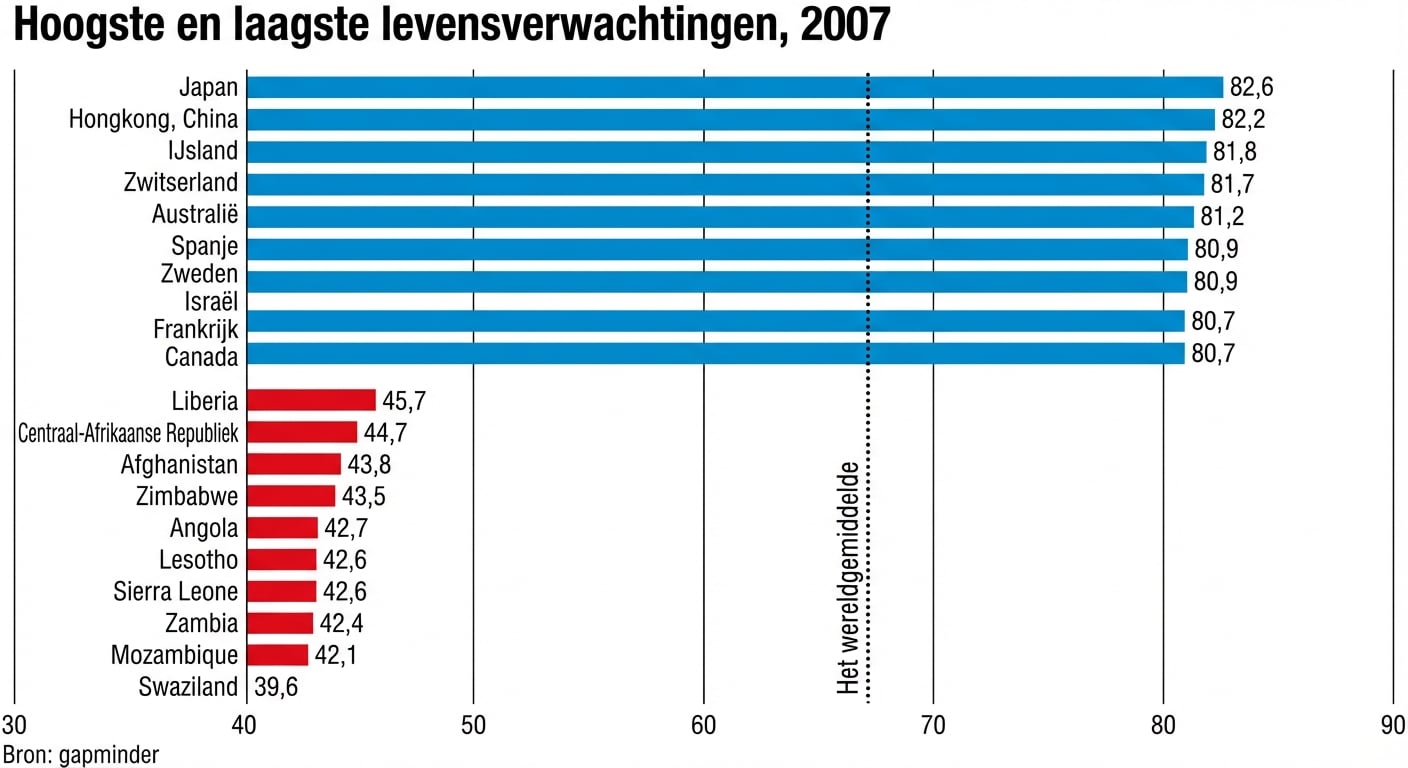
Voeg verfraaiingen toe

