De grammatica van grafieken
Introductie tot datavisualisatie met ggplot2

Rick Scavetta
Founder, Scavetta Academy
The quick brown fox jumps over the lazy dog
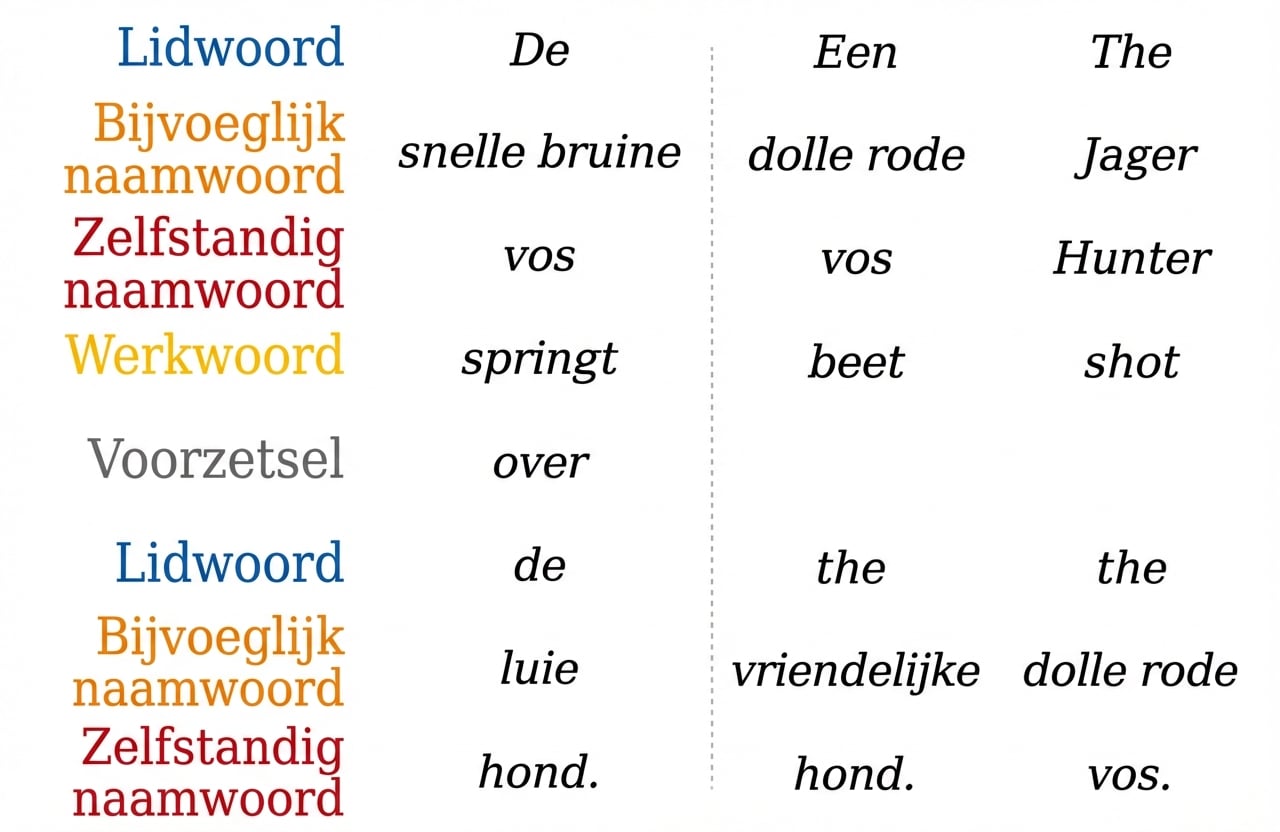
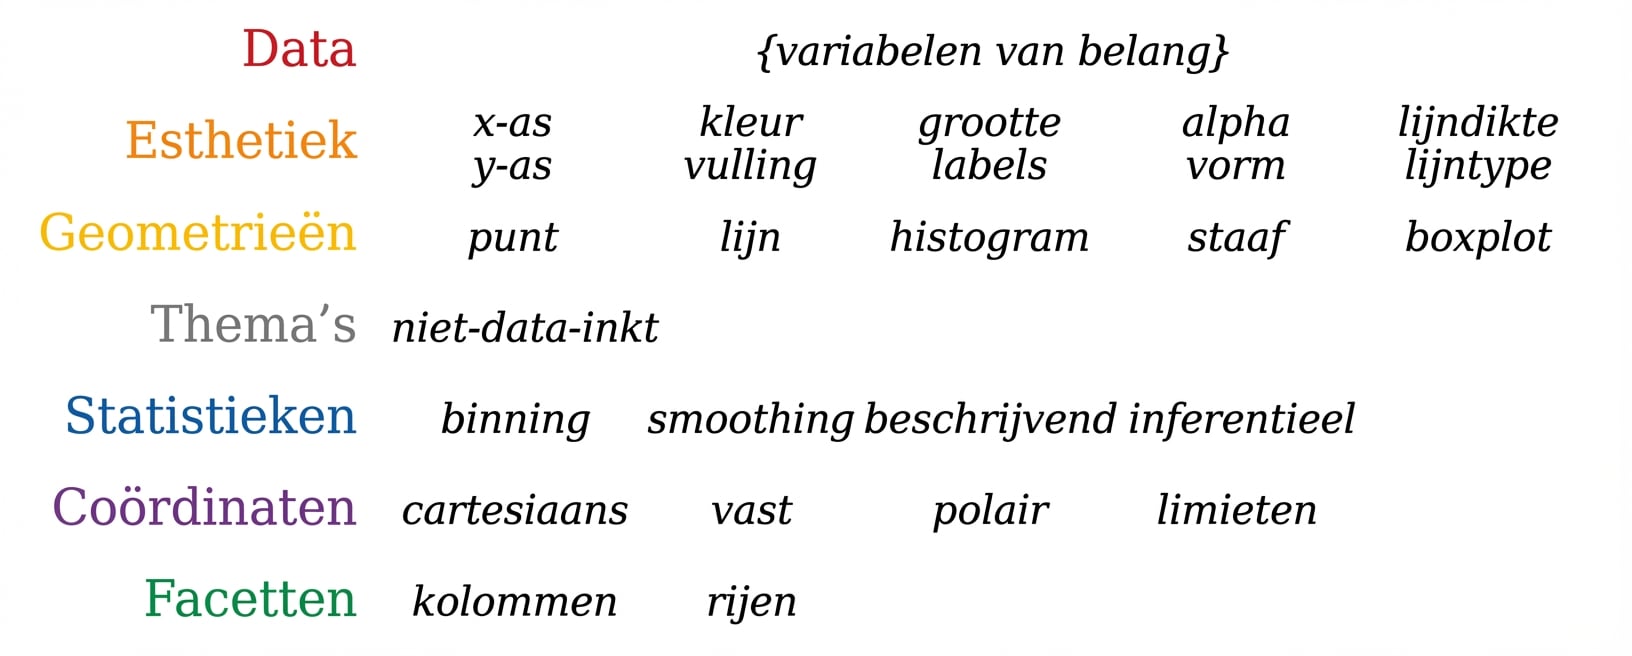
Grammar of graphics
Jargon per component
Introductie tot datavisualisatie met ggplot2
Rick Scavetta
Founder, Scavetta Academy

