Attributen gebruiken
Introductie tot datavisualisatie met ggplot2

Rick Scavetta
Founder, Scavetta Academy
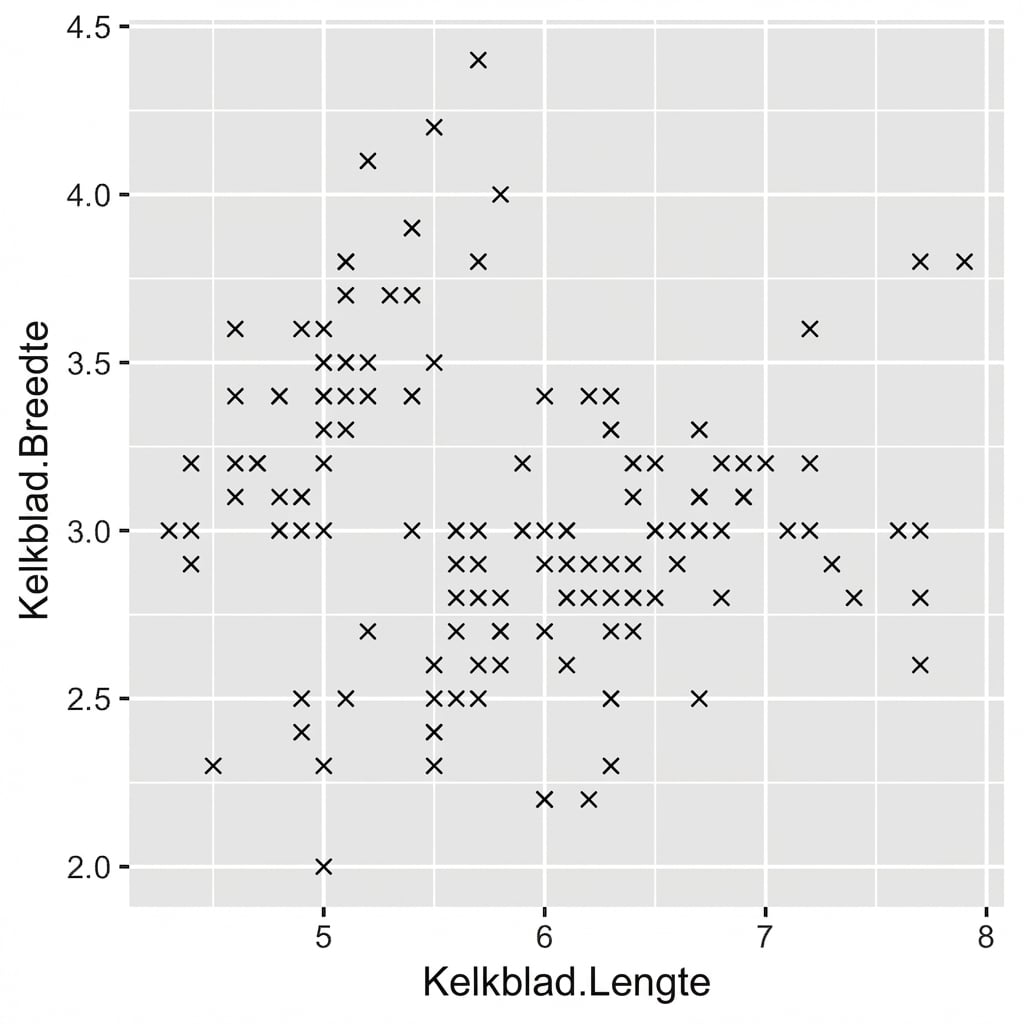
Aesthetics? Attributen!
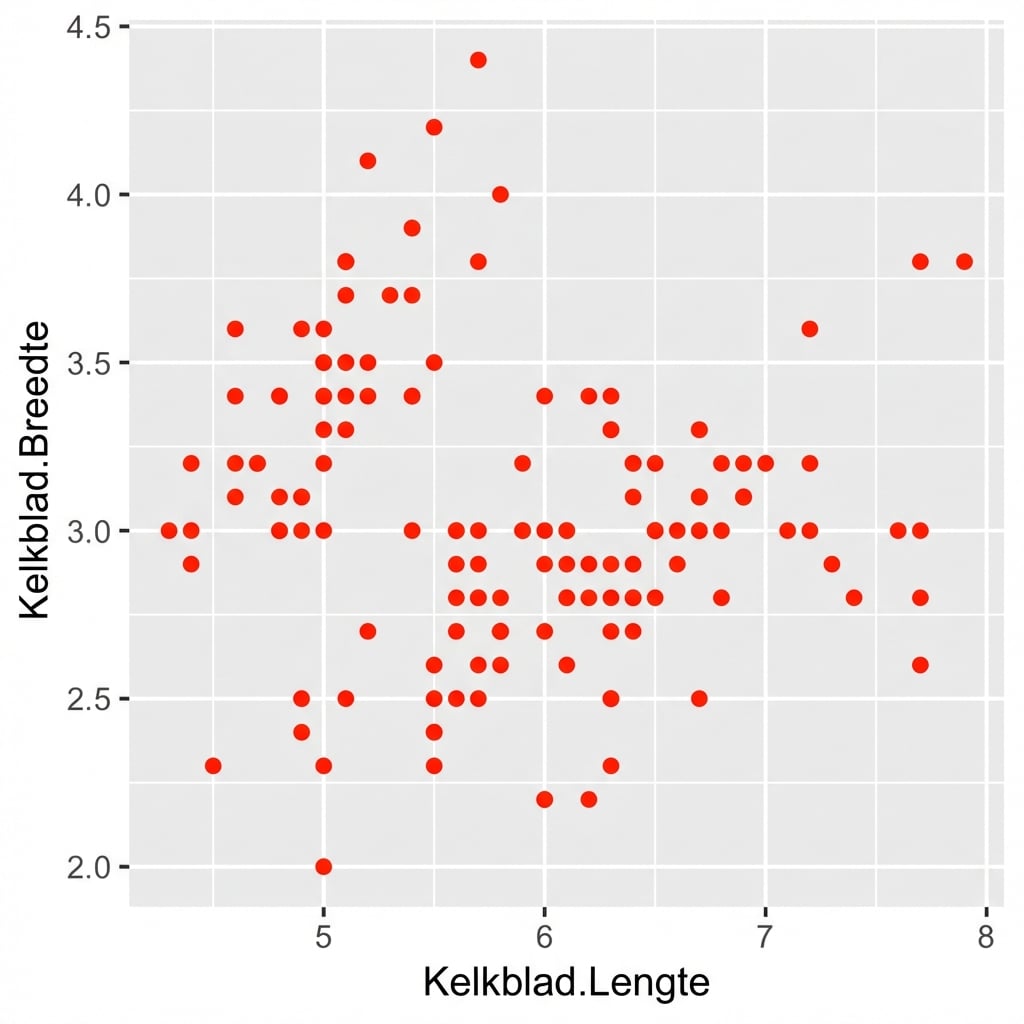
Aesthetics? Attributen!
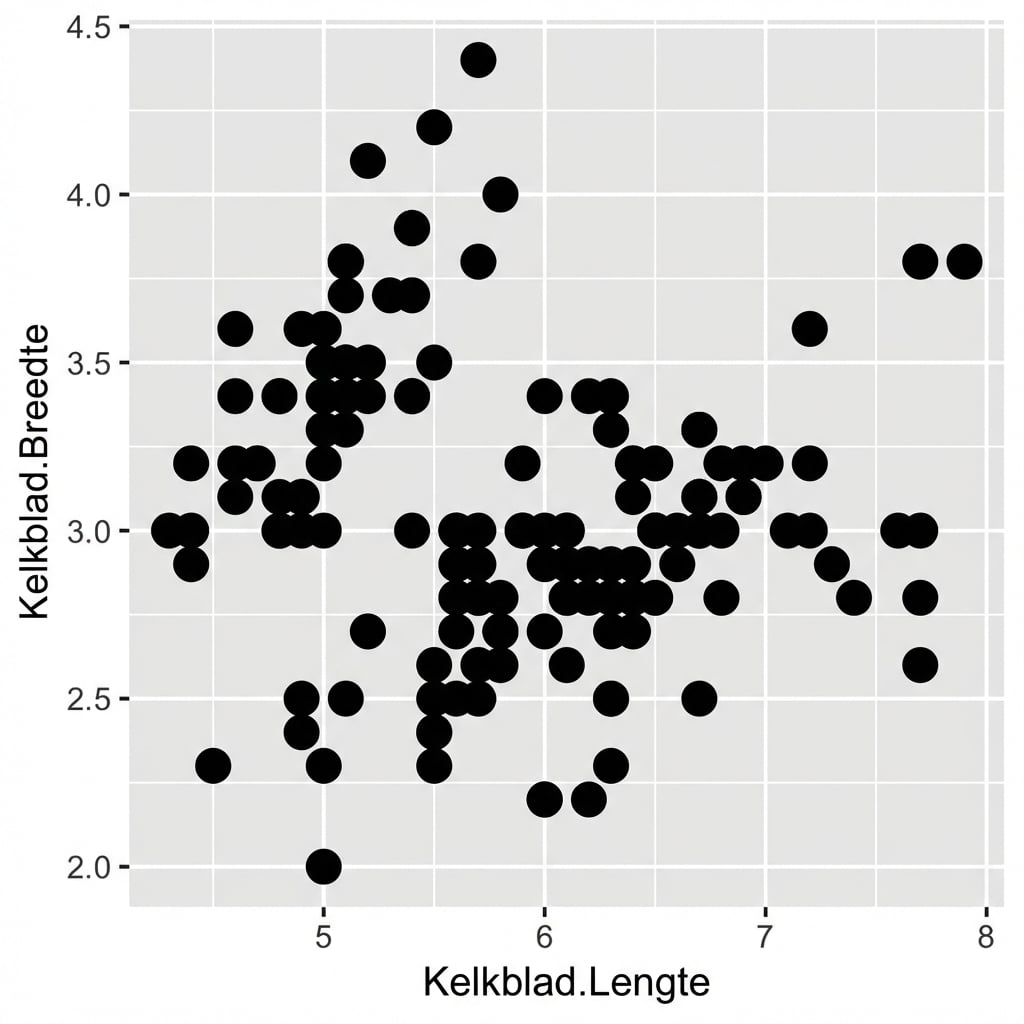
Aesthetics? Attributen!
Introductie tot datavisualisatie met ggplot2
Rick Scavetta
Founder, Scavetta Academy

