Zichtbare esthetieken
Introductie tot datavisualisatie met ggplot2

Rick Scavetta
Founder, Scavetta Academy
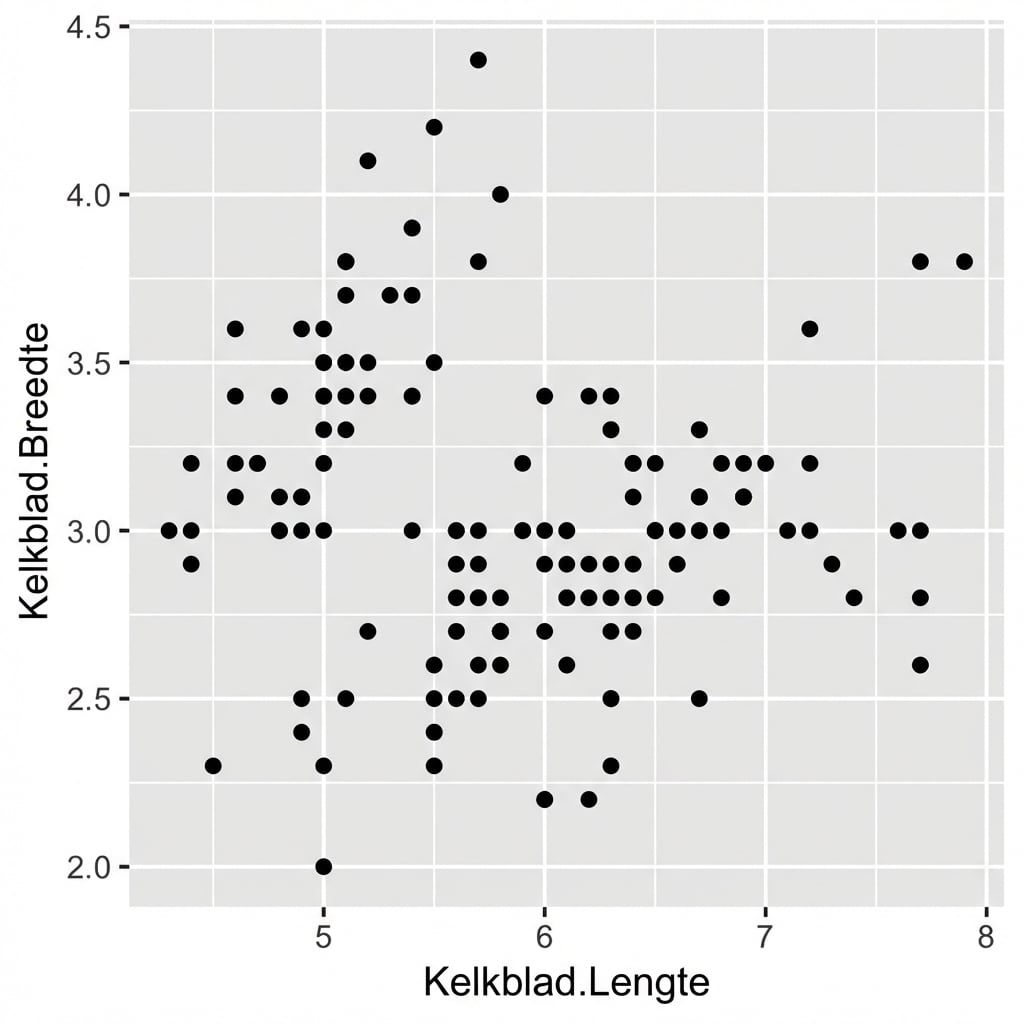
Mappen op de X- en Y-as
Mappen op kleur
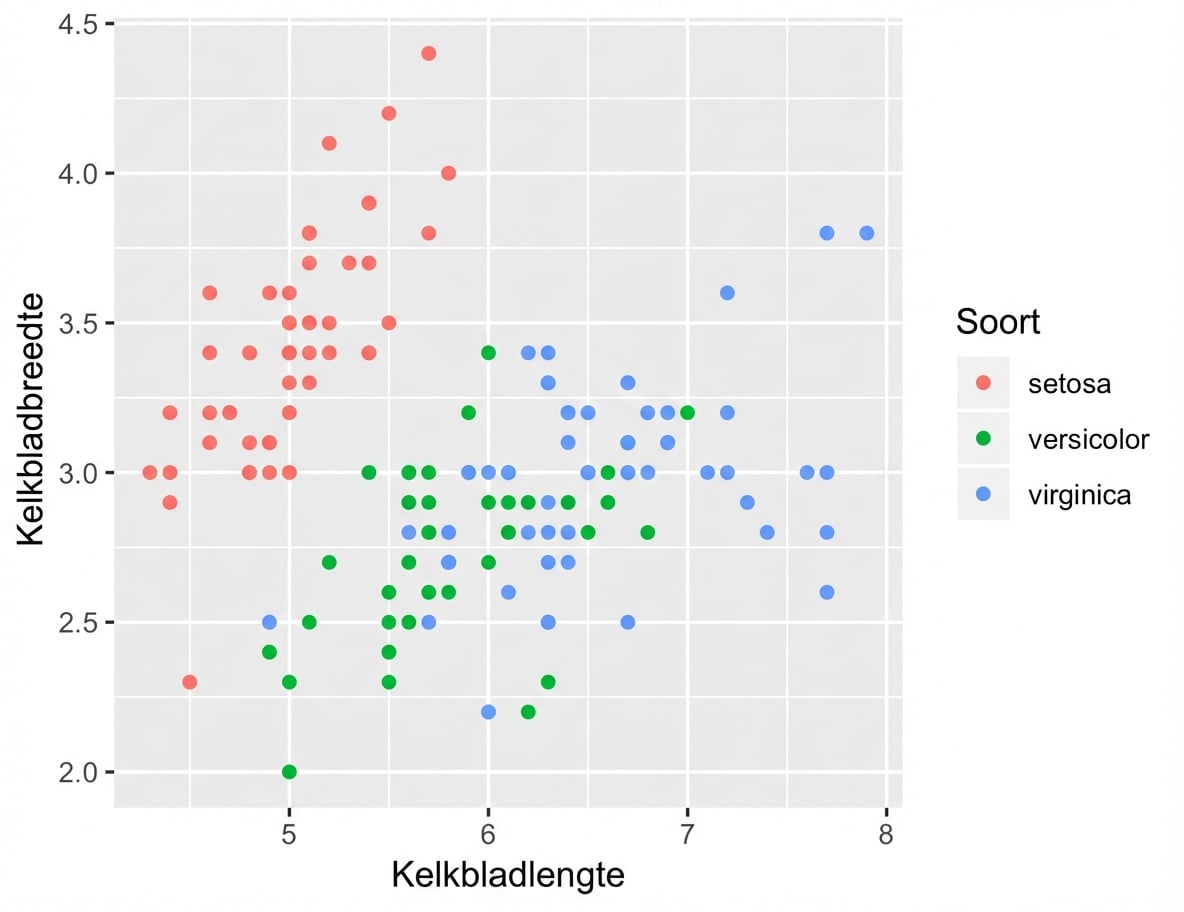
Mappen op de kleur-esthetiek
Mappen op de kleur-esthetiek
Mappen op de kleur-esthetiek in geom
Introductie tot datavisualisatie met ggplot2
Rick Scavetta
Founder, Scavetta Academy

