Introductie
Introductie tot datavisualisatie met ggplot2

Rick Scavetta
Founder, Scavetta Academy
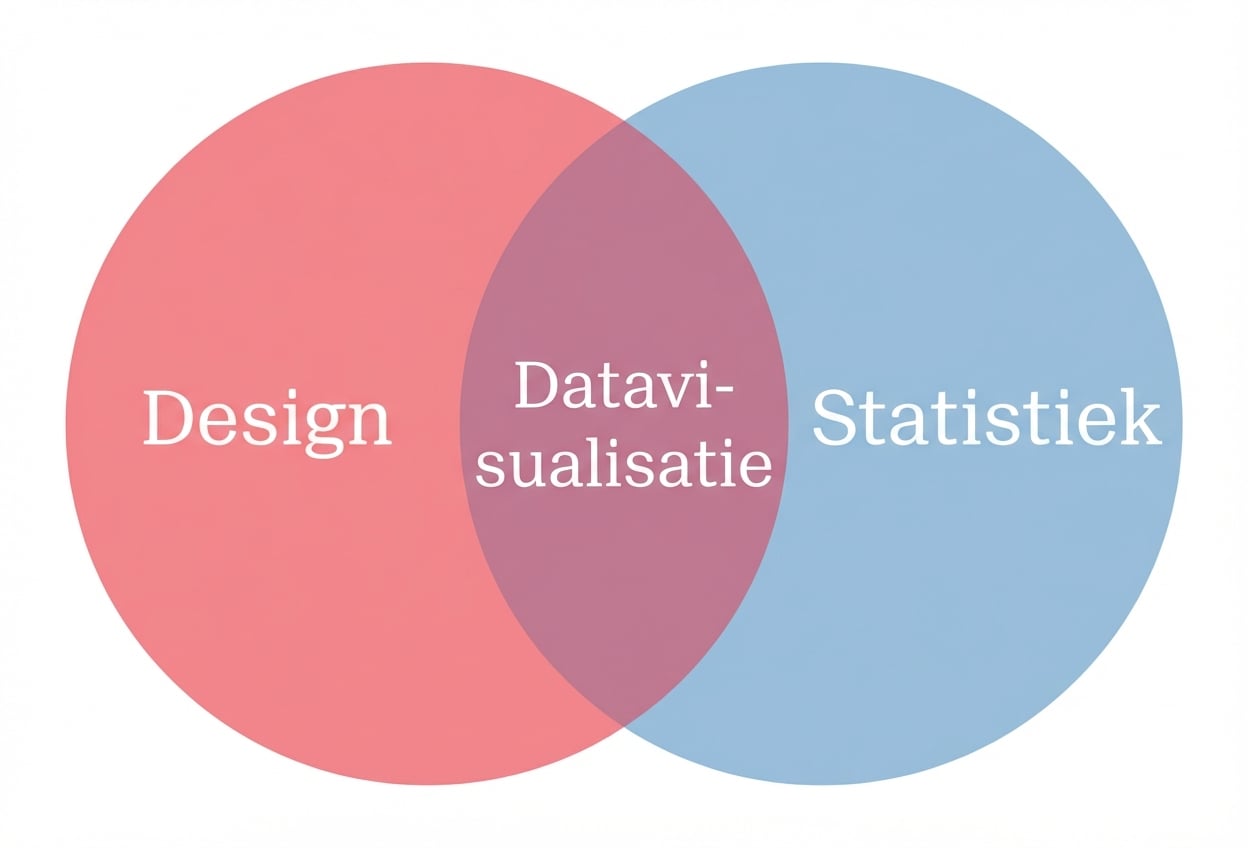
Datavisualisatie & data science
- Een kernvaardigheid in data science.
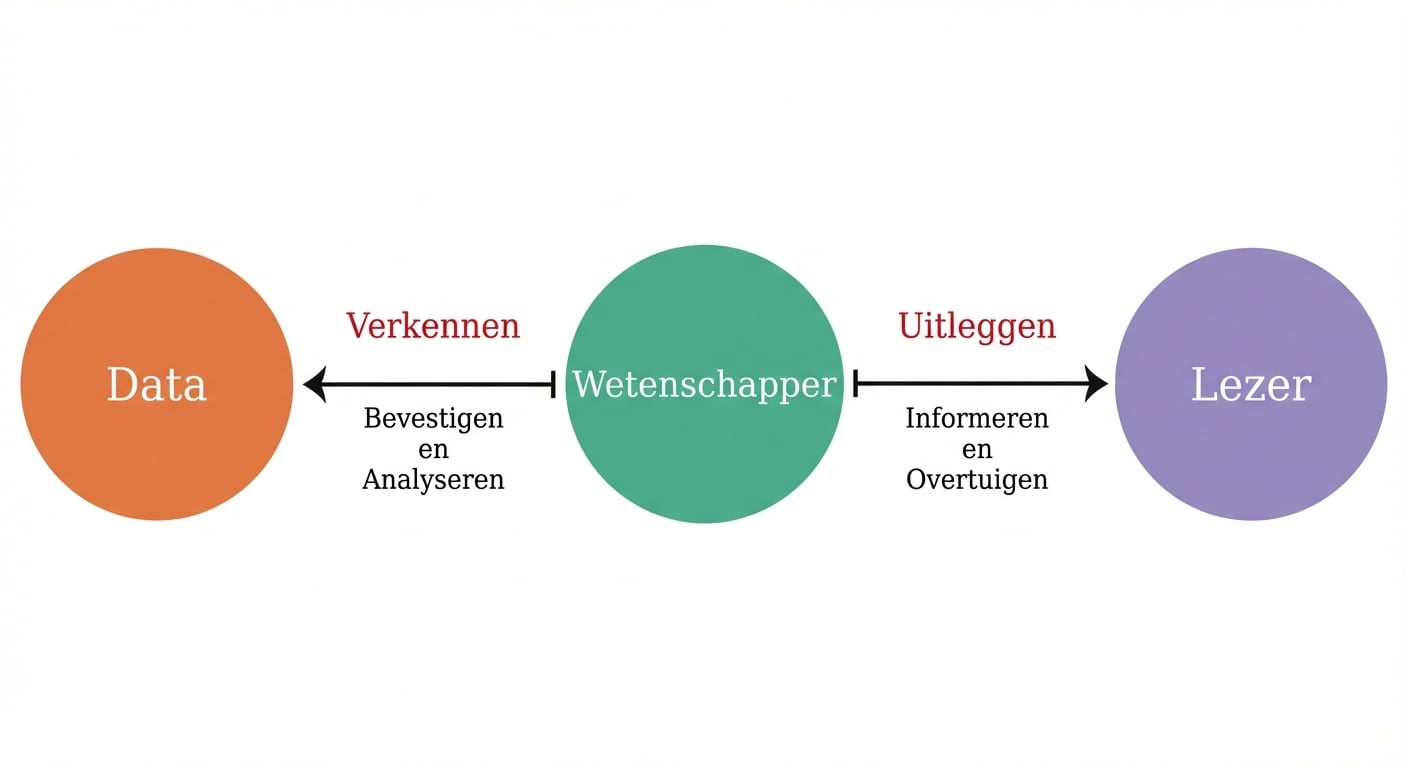
Explorerend versus verklarend
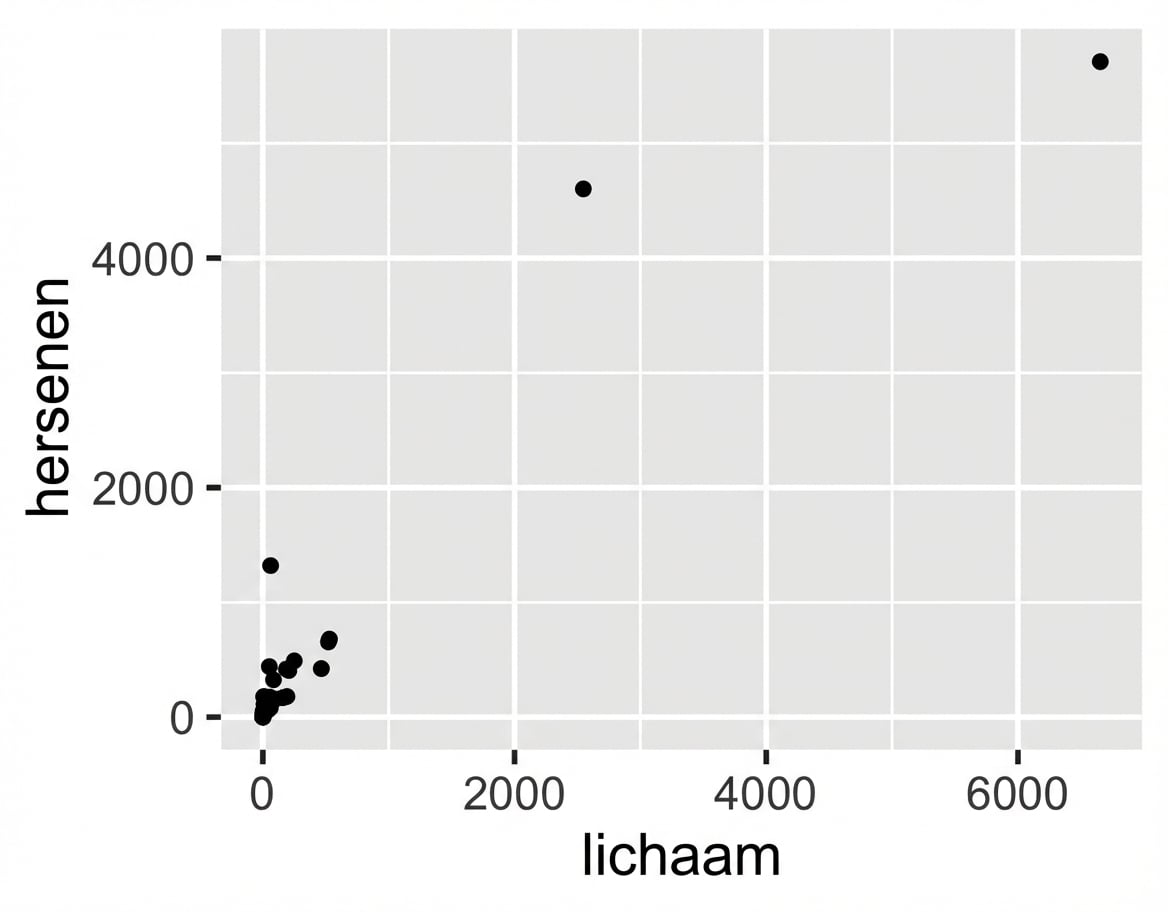
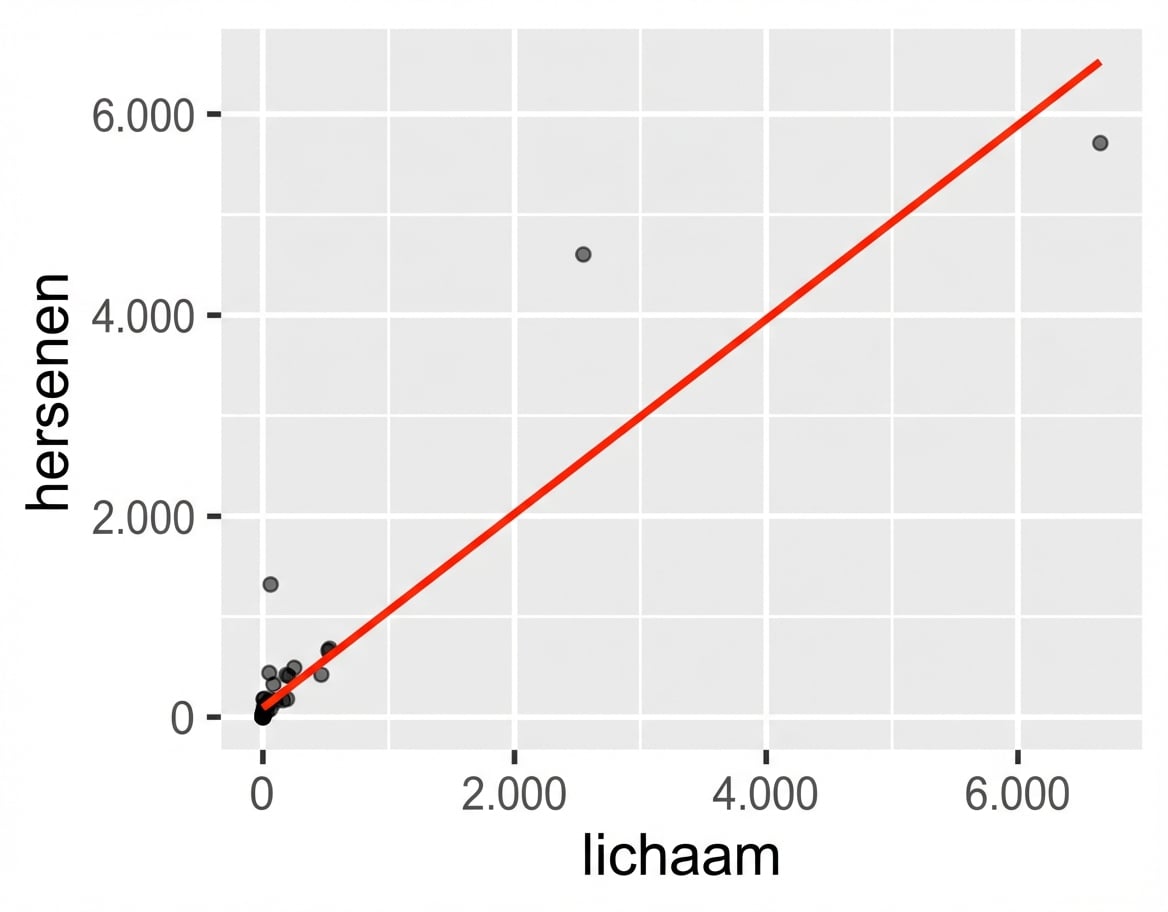
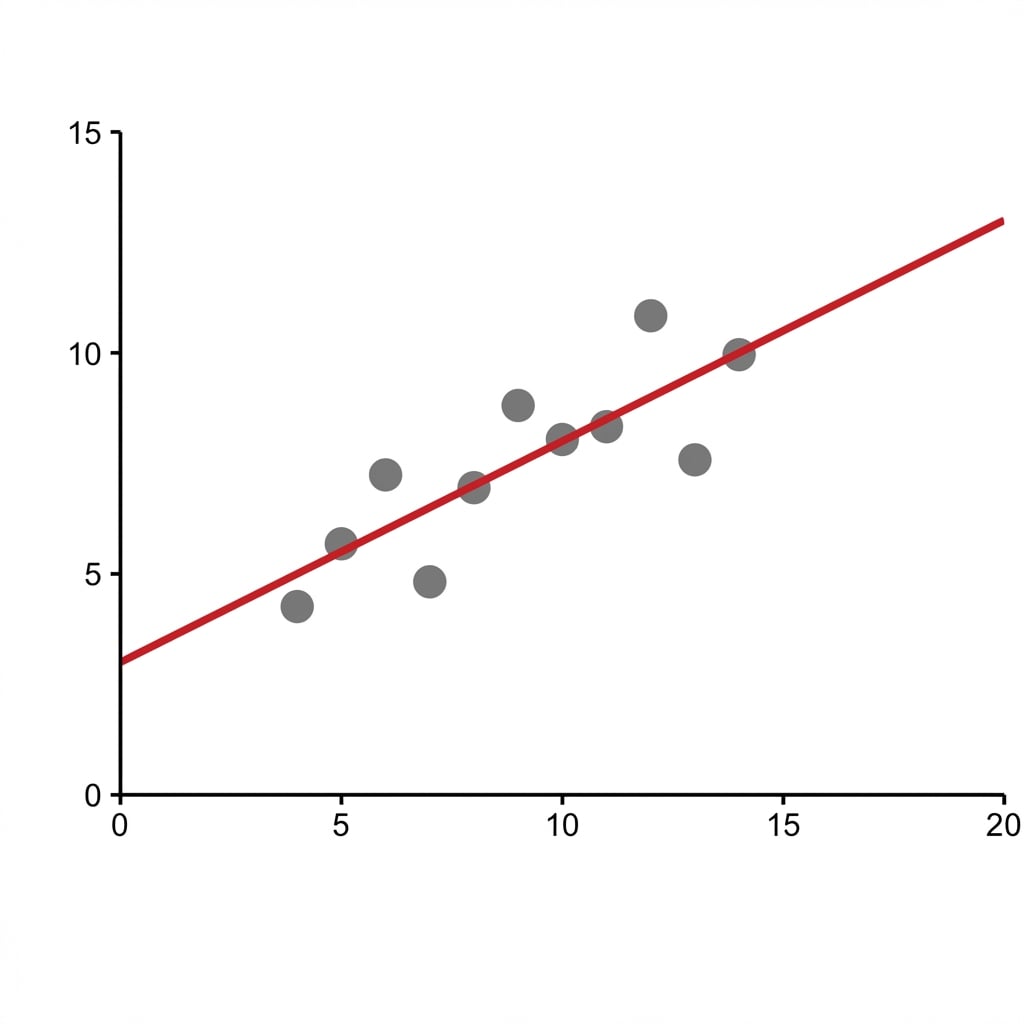
Een spreidingsdiagram
Verkennen met een lineair model
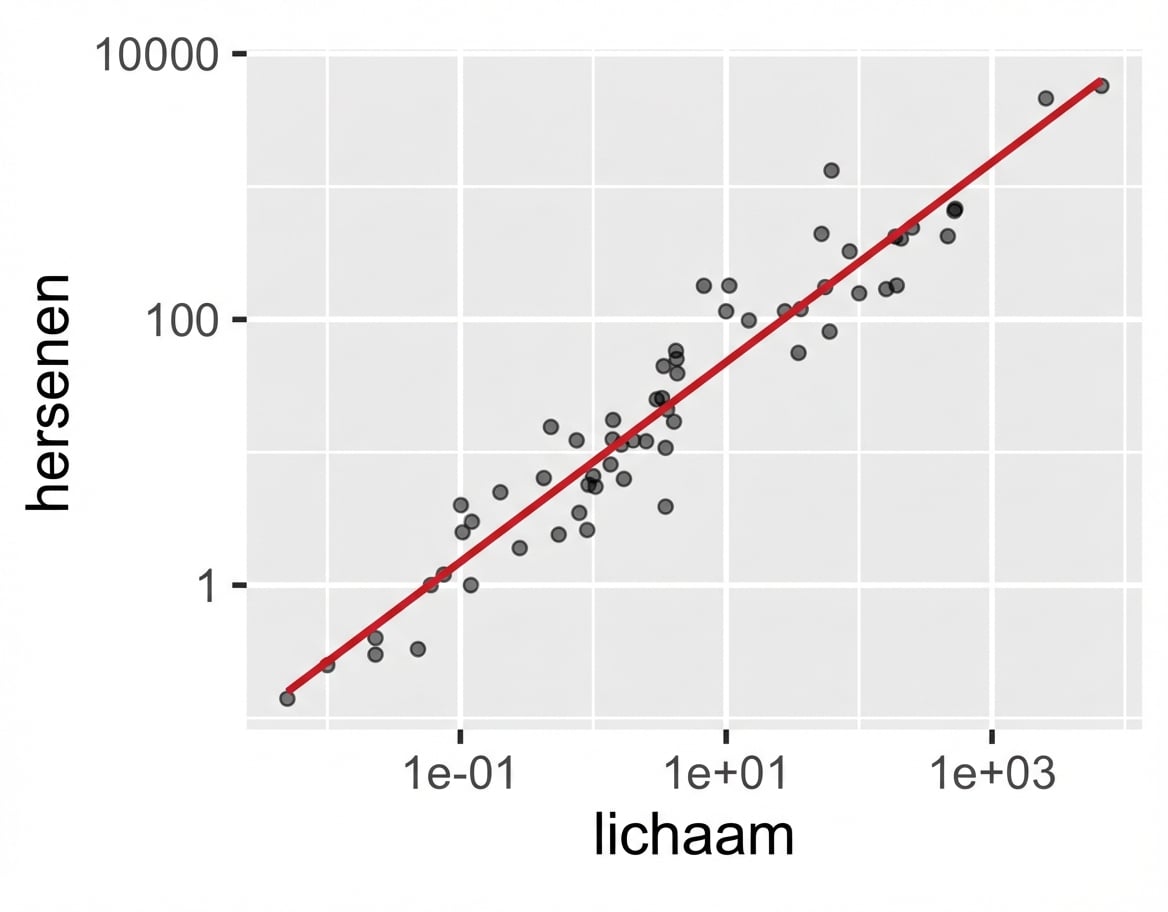
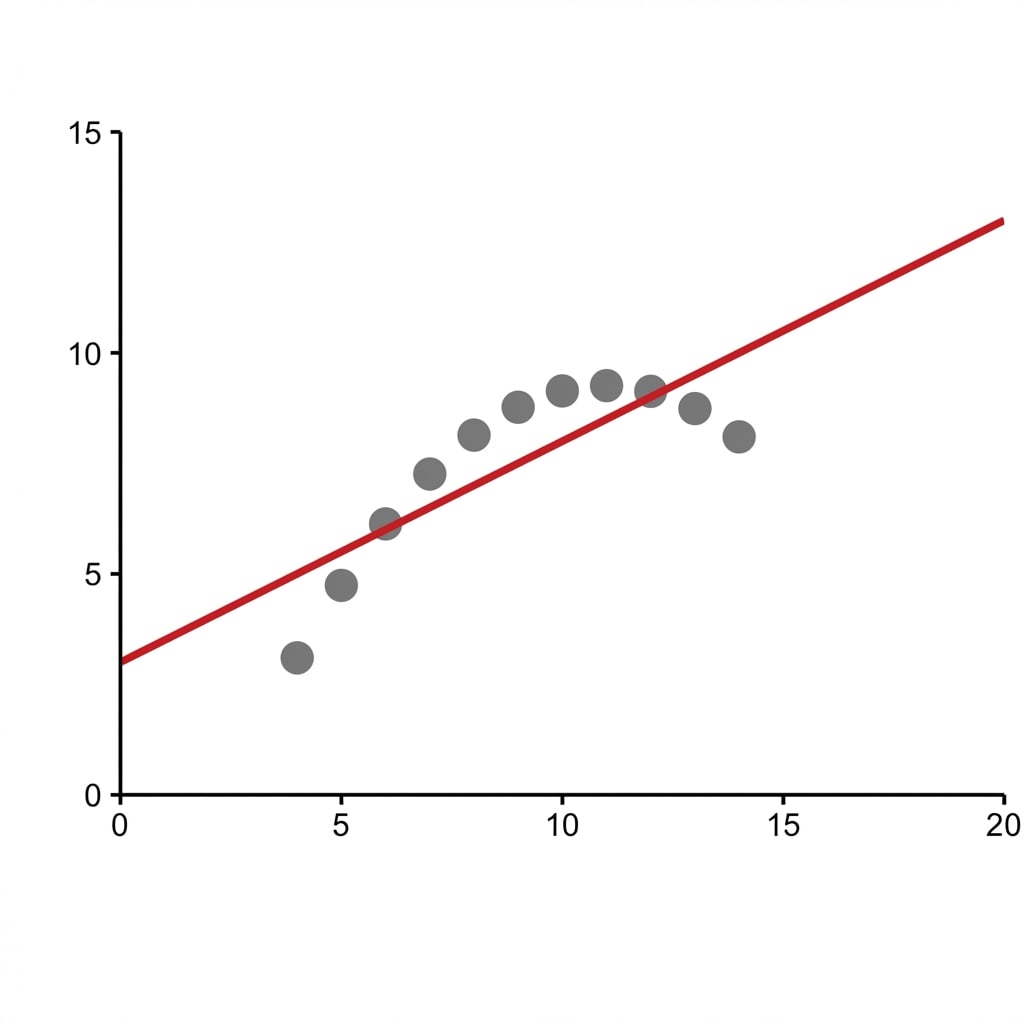
Verkennen: fijn afstellen
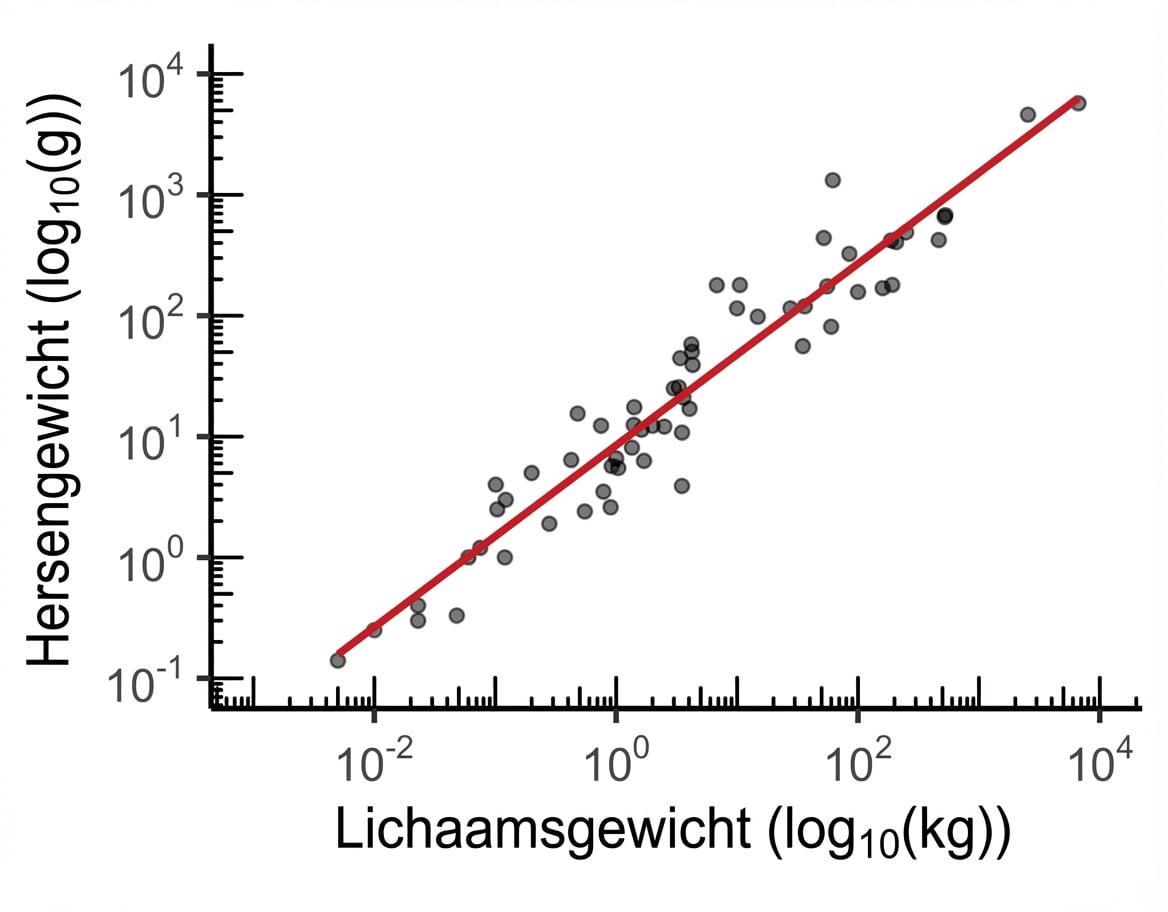
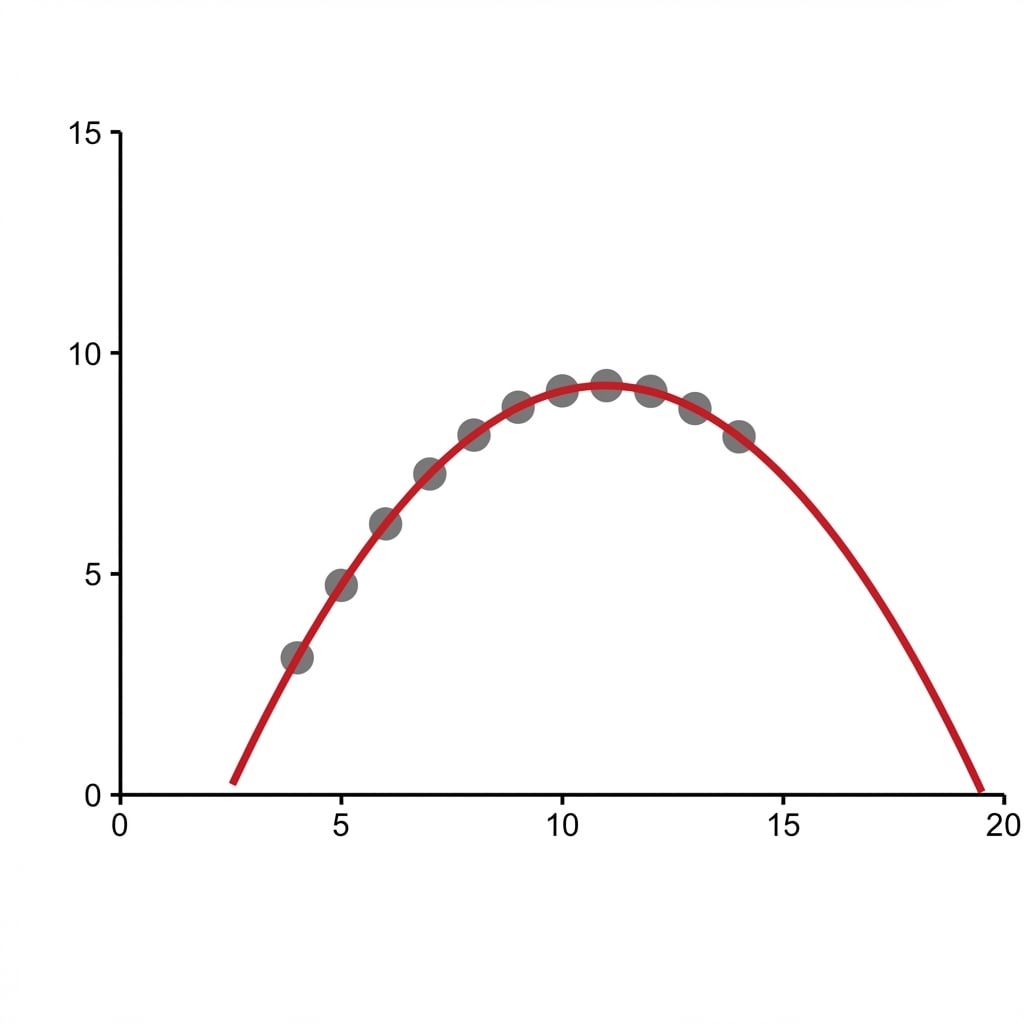
Publicatieklare plot
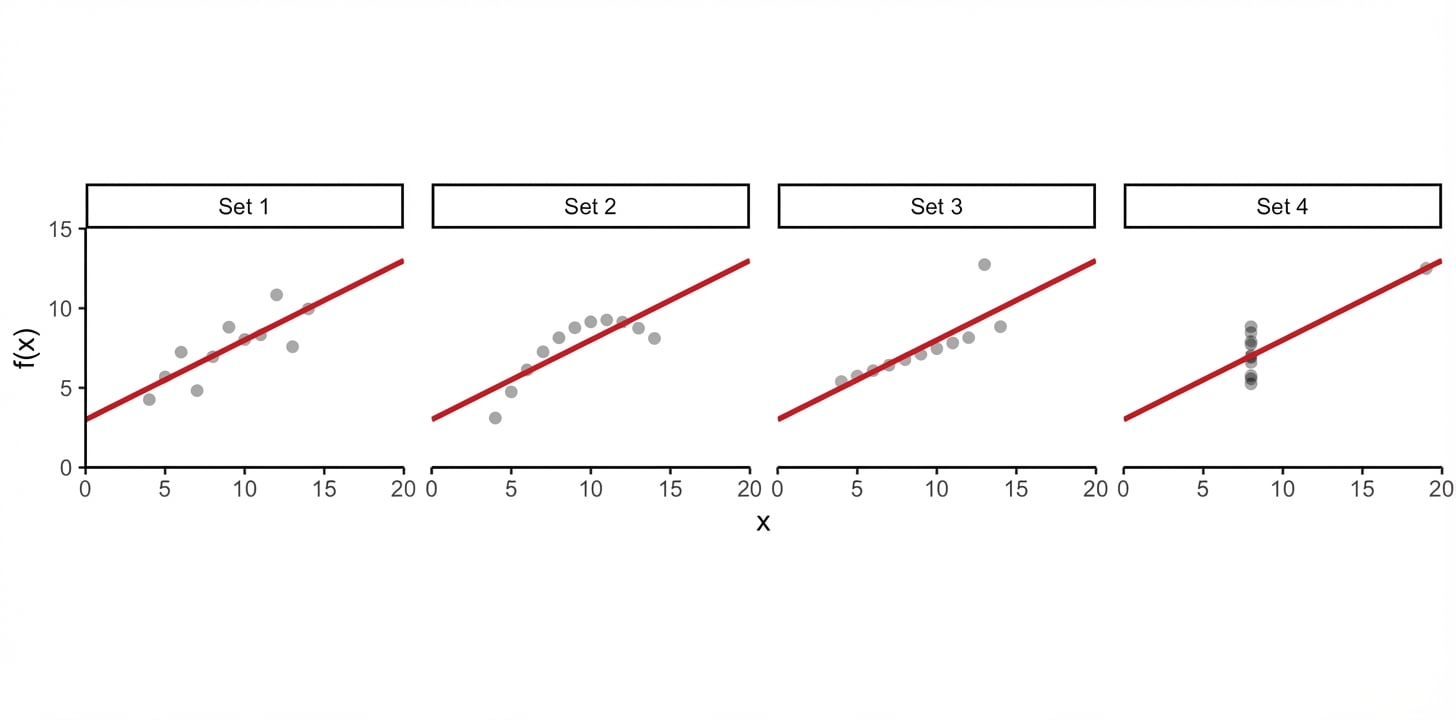
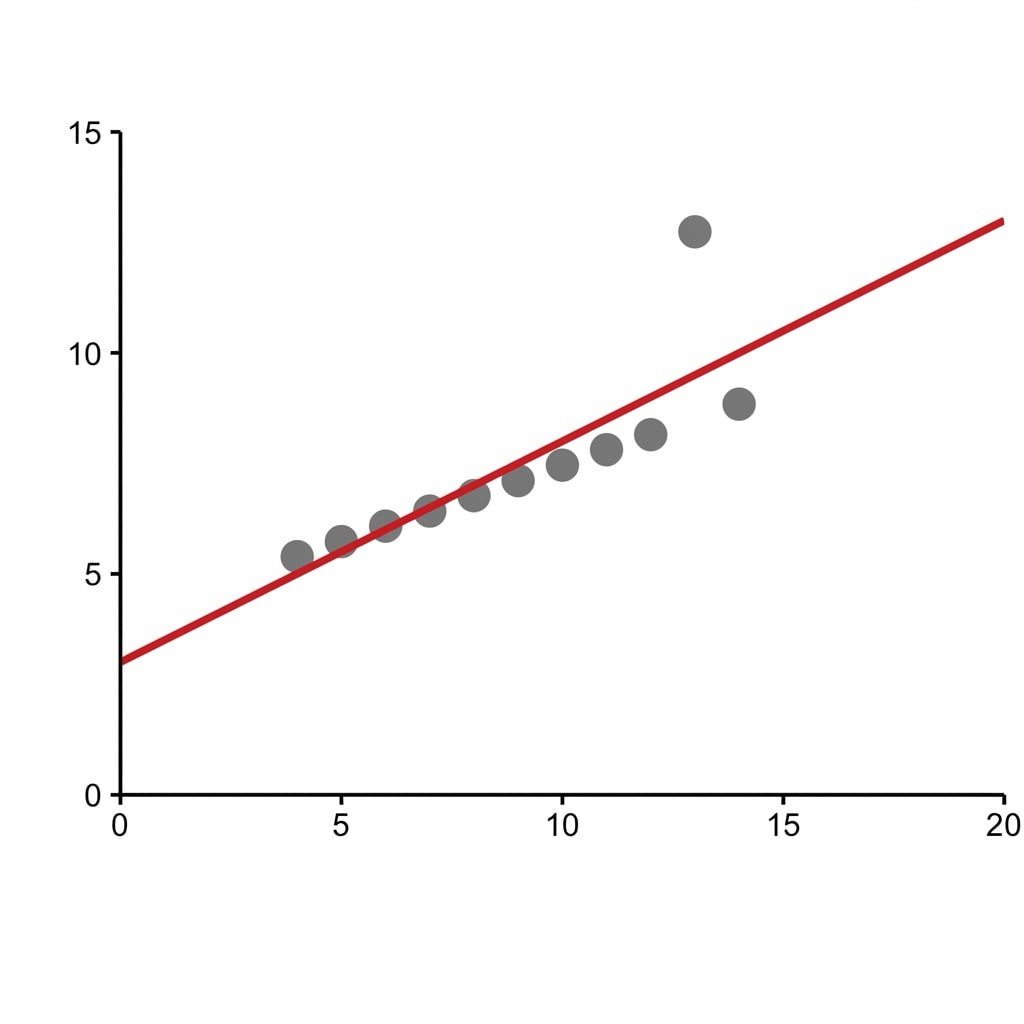
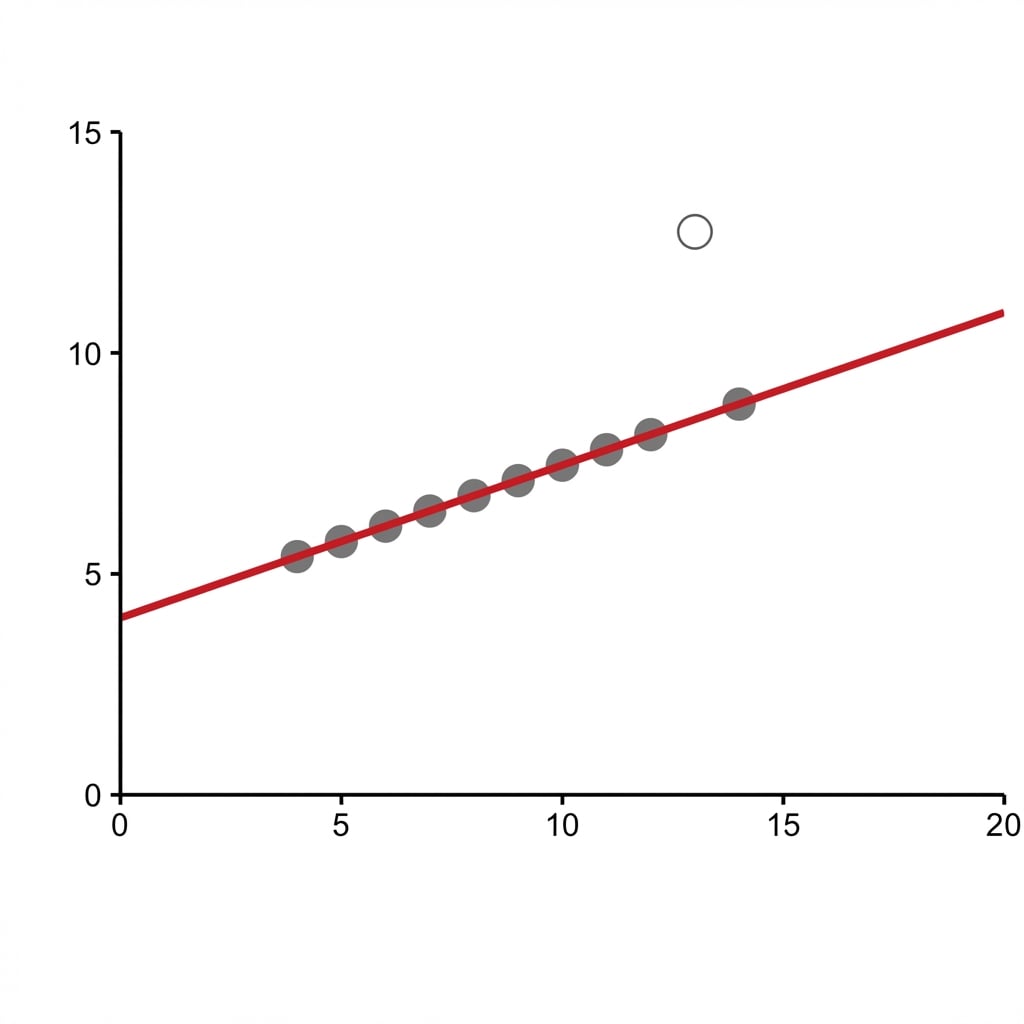
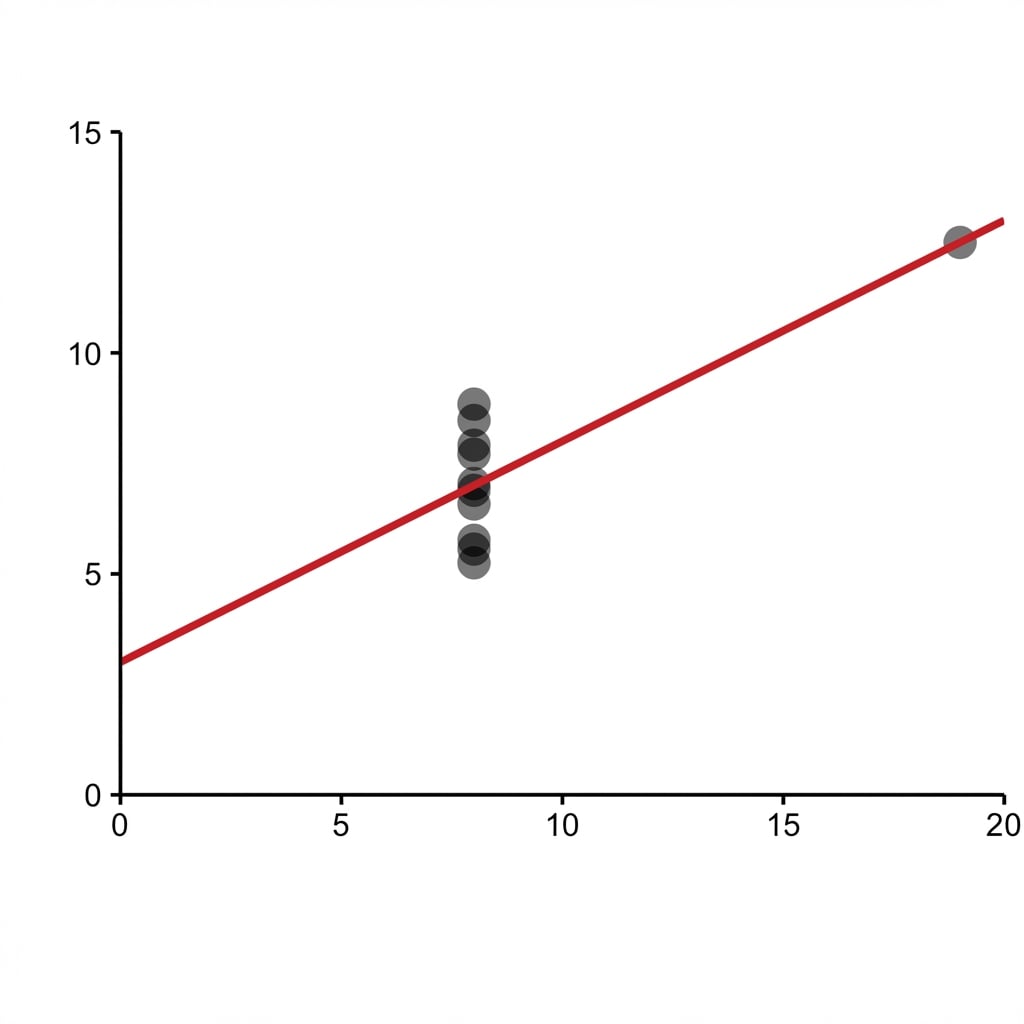
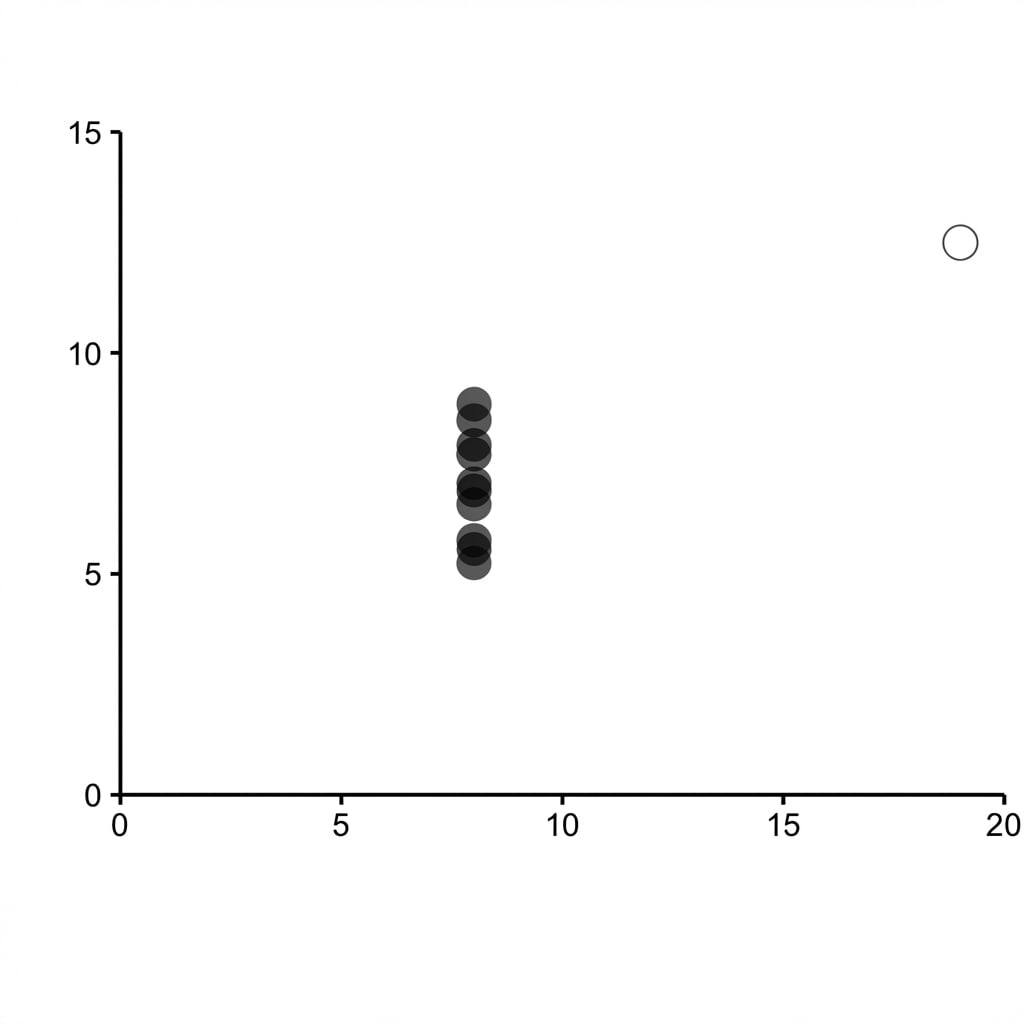
Anscombe-plots
Anscombe-plots
Anscombe-plots
Anscombe-plots
Anscombe-plots
Anscombe-plots
Anscombe-plots
Anscombe-plots
Anscombe-plots