Histogrammen
Introductie tot datavisualisatie met ggplot2

Rick Scavetta
Founder, Scavetta Academy
Histogrammen
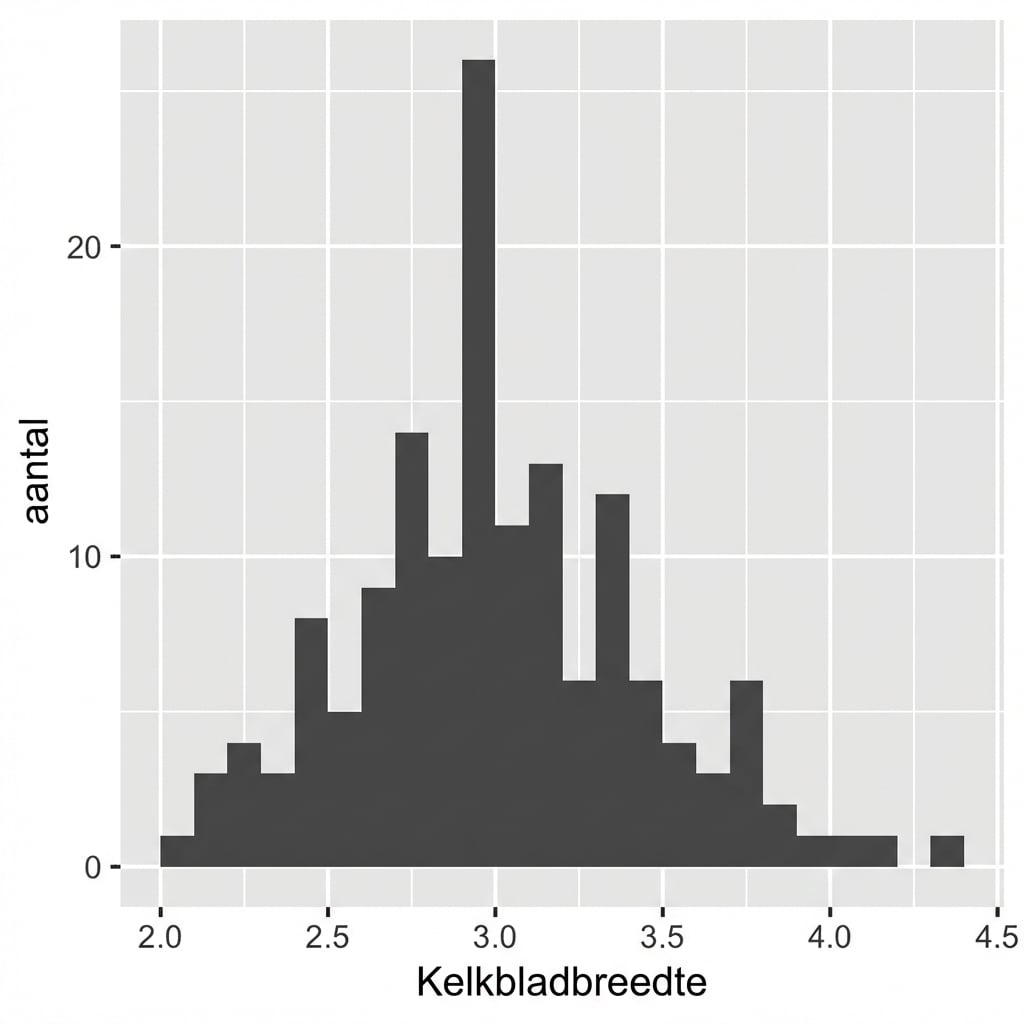
Standaard: 30 gelijke bins
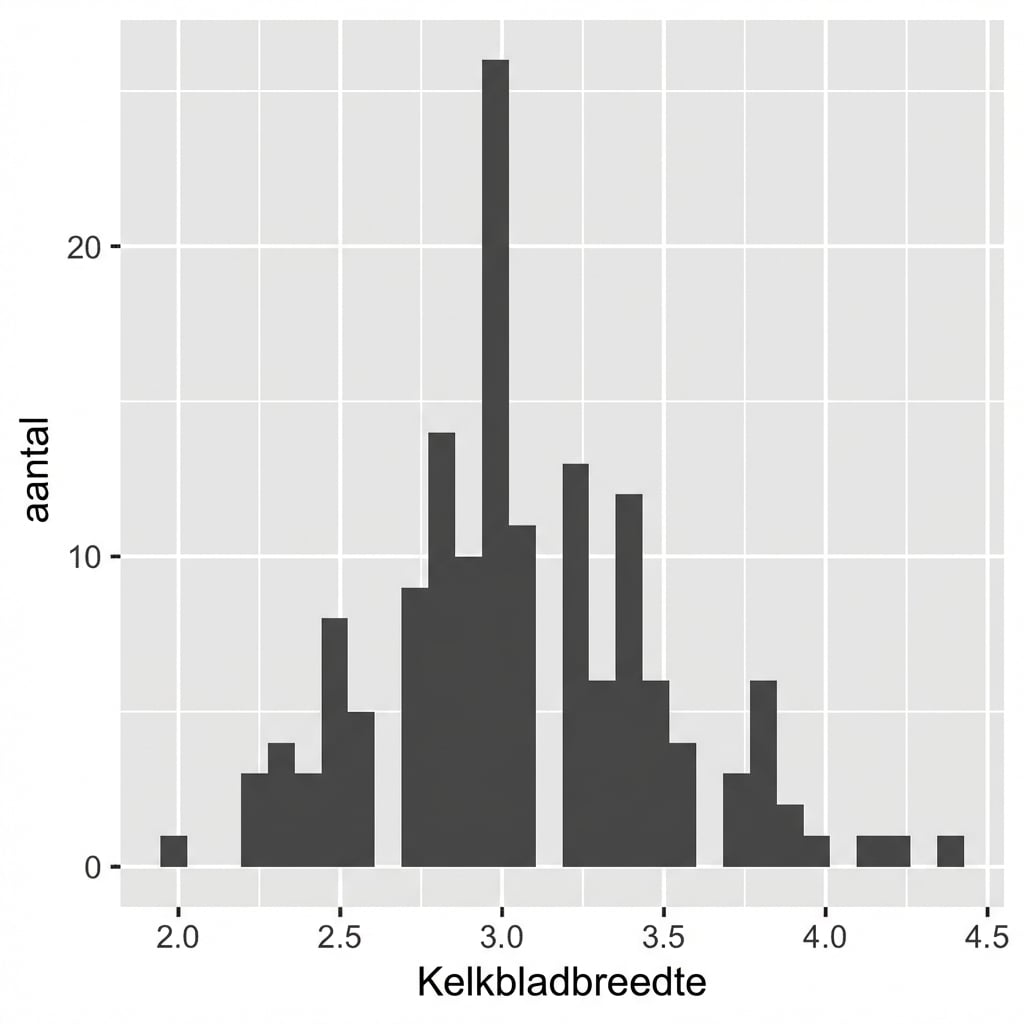
Intuïtieve en zinvolle binklassen
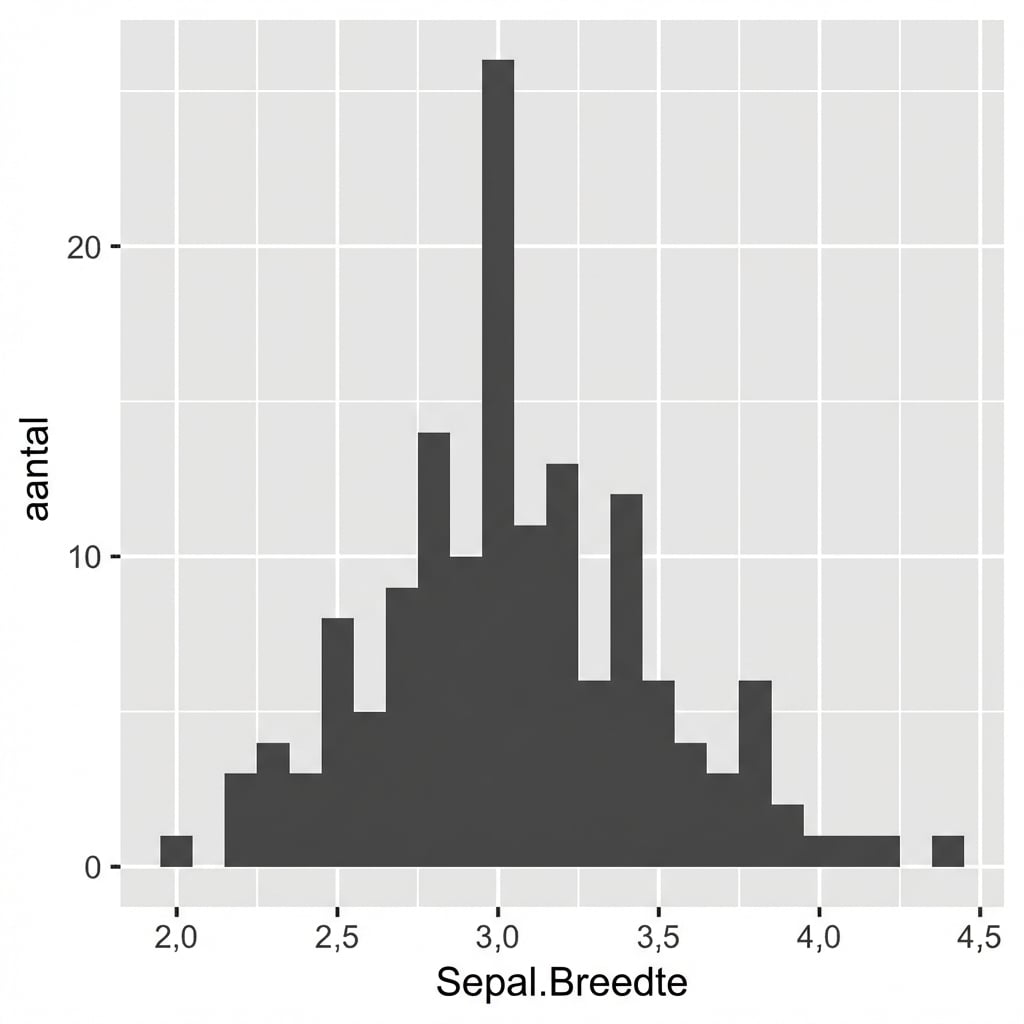
Plaats markeringen opnieuw
Verschillende soorten
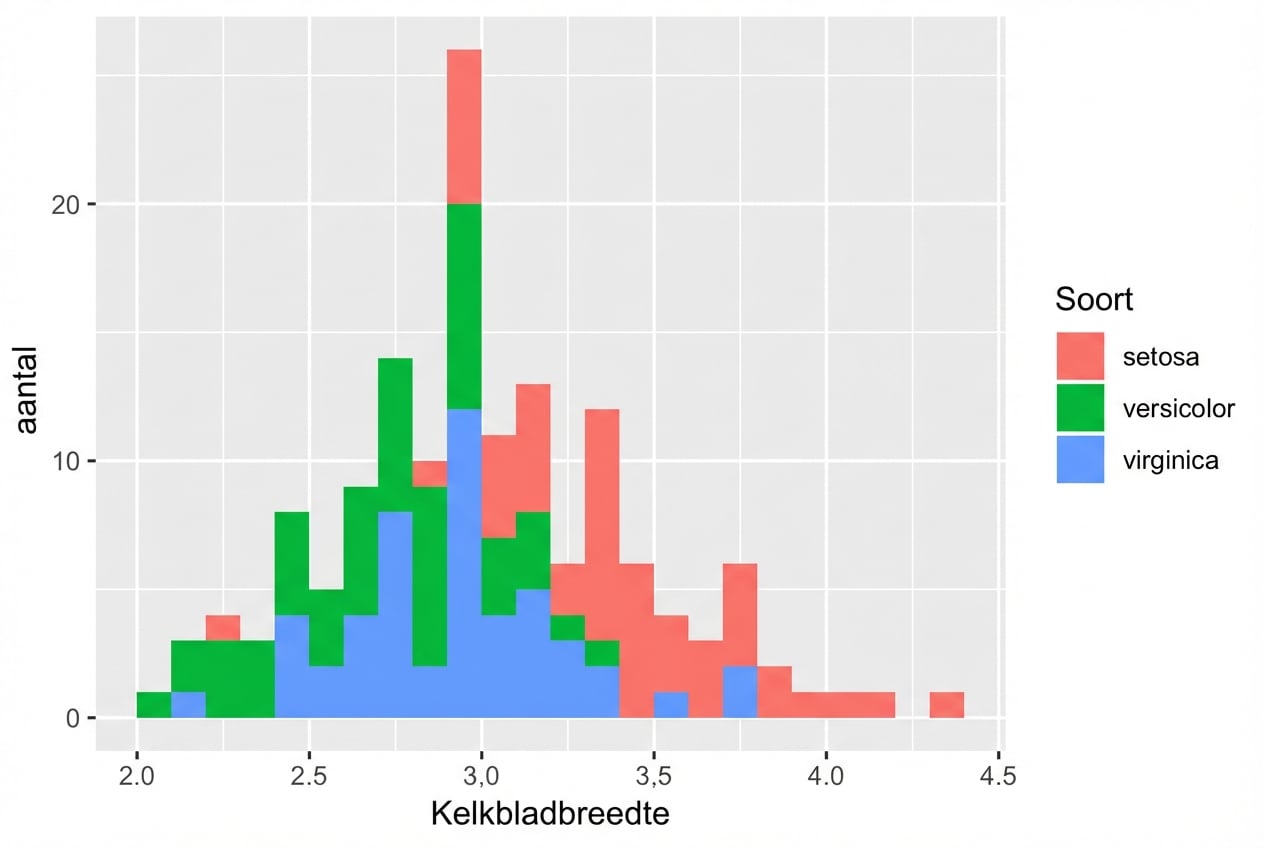
Standaardpositie is "stack"
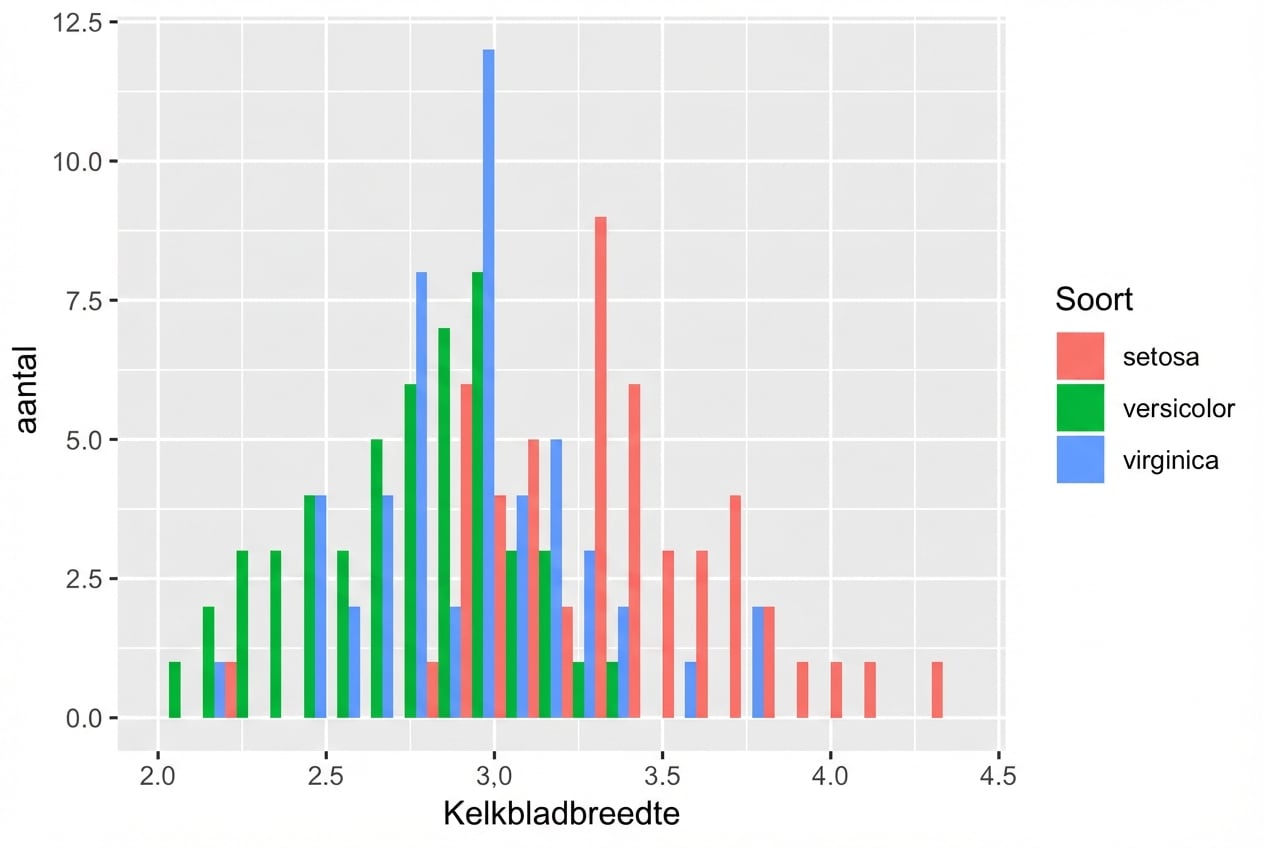
position = "dodge"
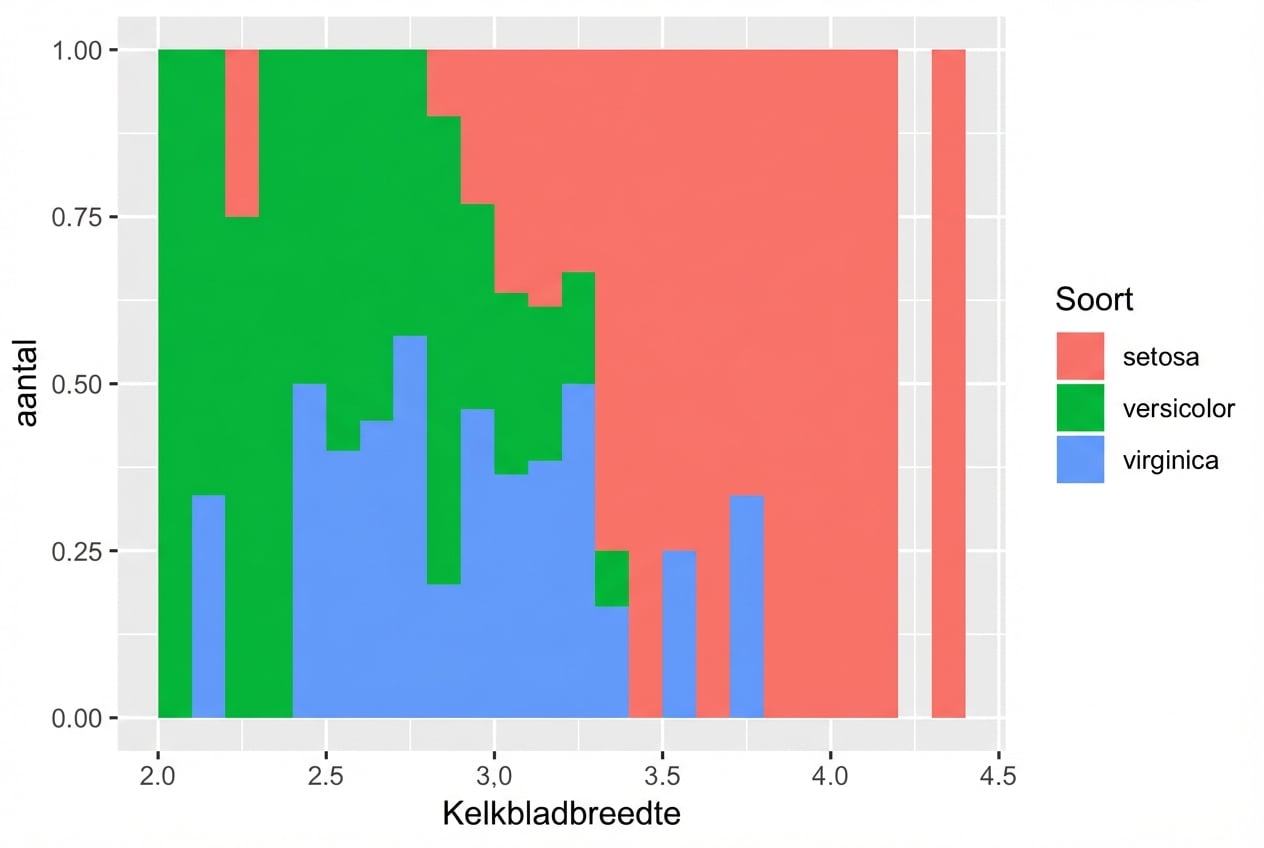
position = "fill"