ggplot2-lagen
Introductie tot datavisualisatie met ggplot2

Rick Scavetta
Founder, Scavetta Academy
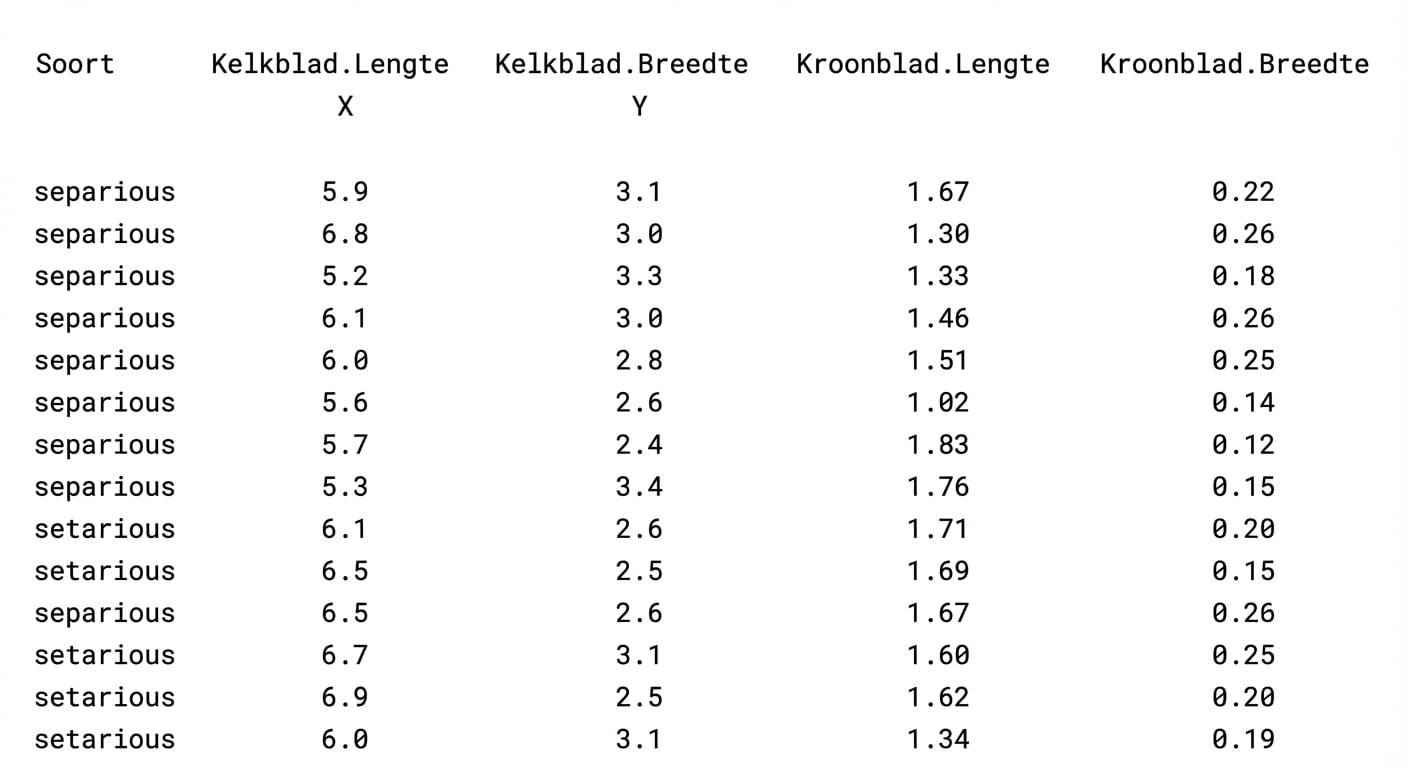
Data

Iris-dataset
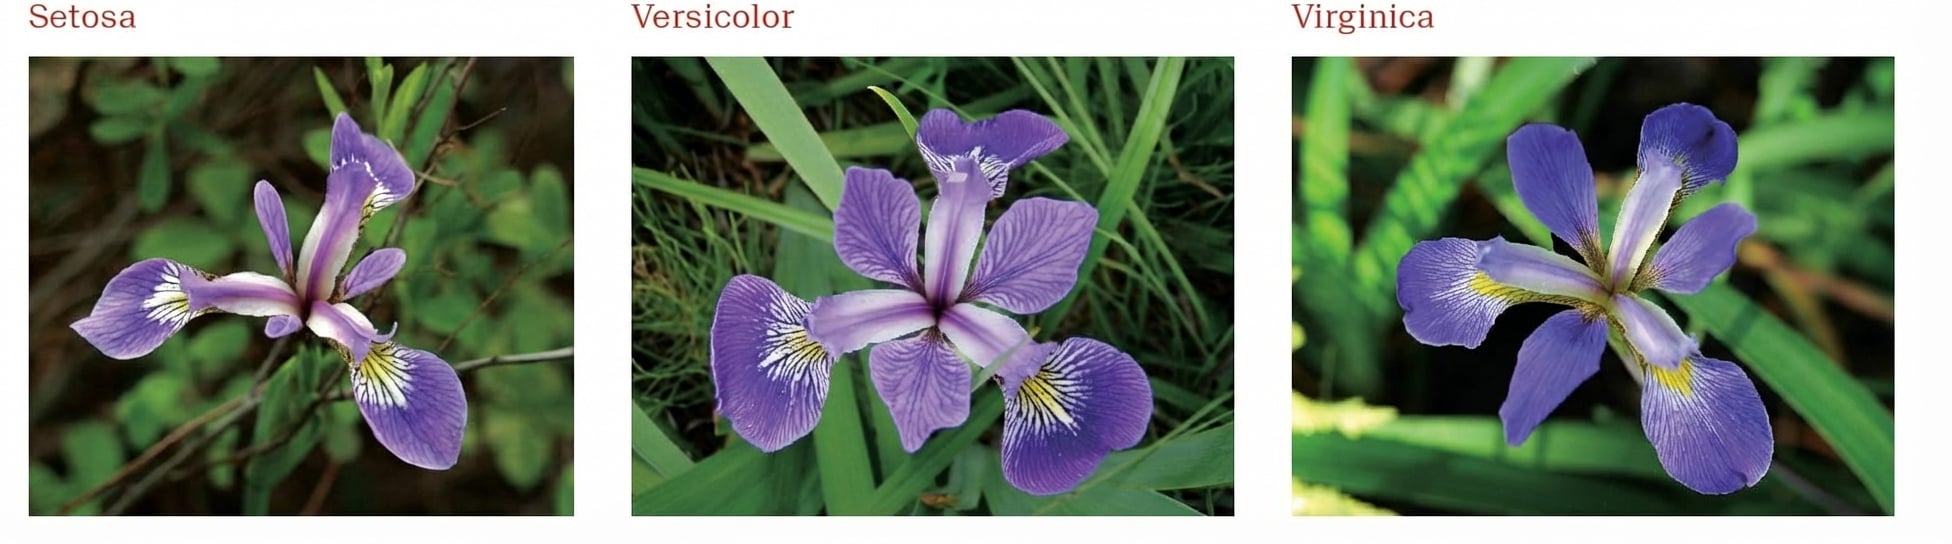
1 Fisher, R. A. (1936) The use of multiple measurements in taxonomic problems. Annals of Eugenics, 7, Part II, 179–188. 2 Anderson, Edgar (1935). The irises of the Gaspe Peninsula, Bulletin of the American Iris Society, 59, 2–5.
Vormgeving (aesthetics)

Iris-aesthetics
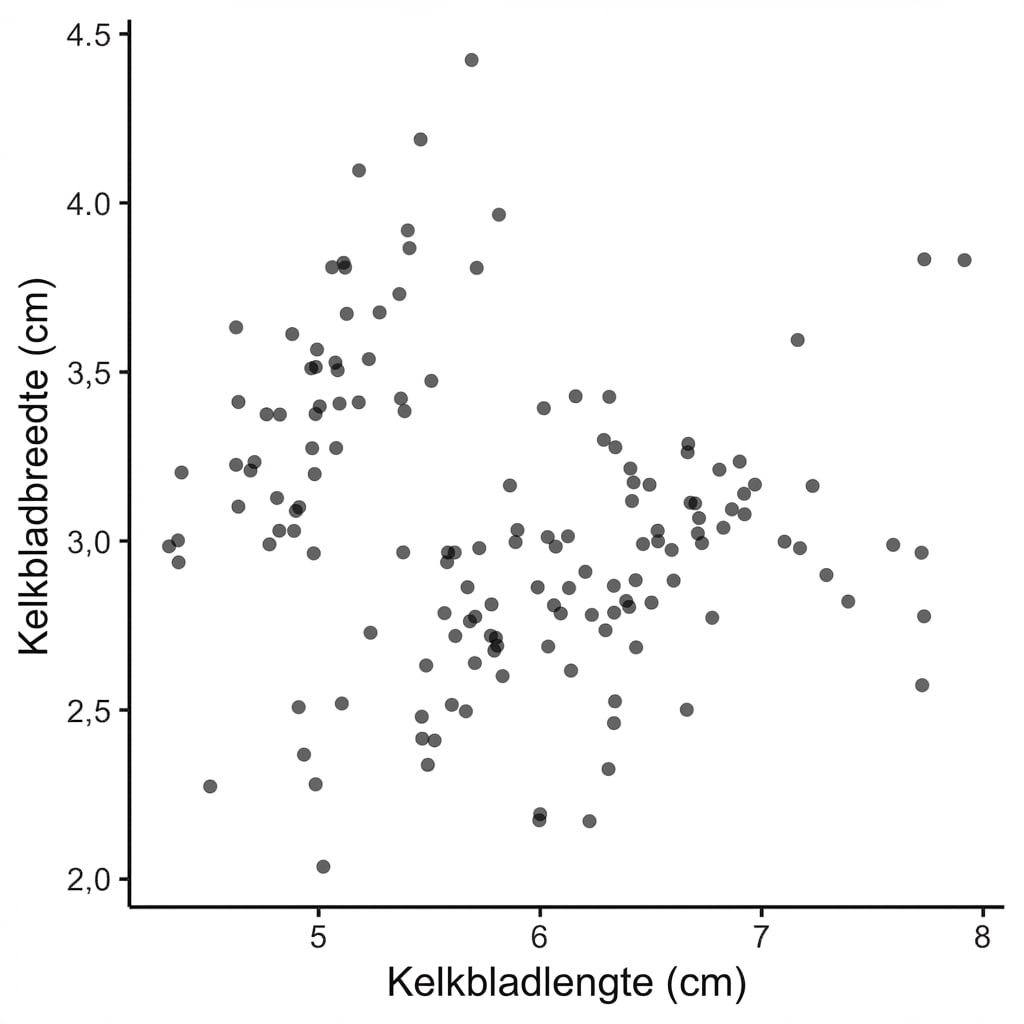
Geometrieën

Iris-geometrieën
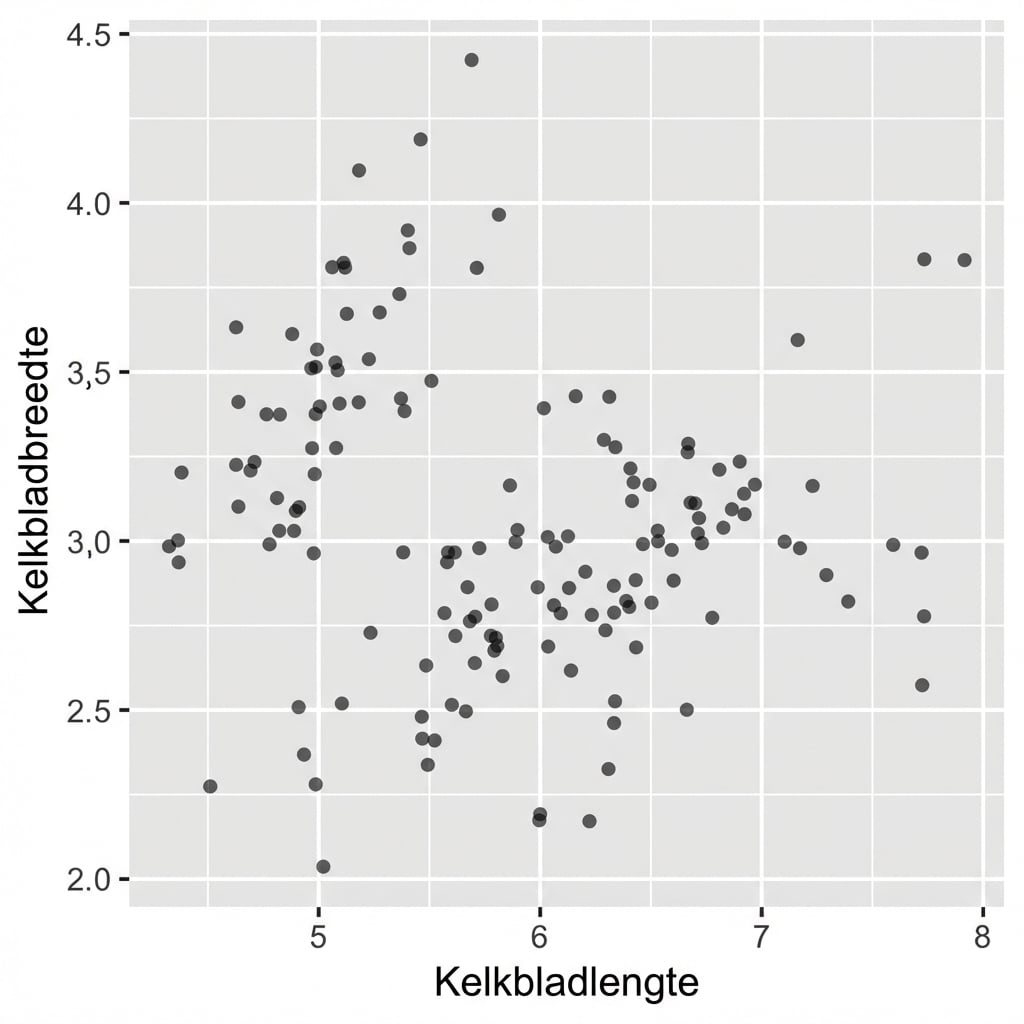
Thema’s

Iris-thema’s