Introductie tot lijndiagrammen
Introductie tot datavisualisatie met Seaborn

Content Team
DataCamp
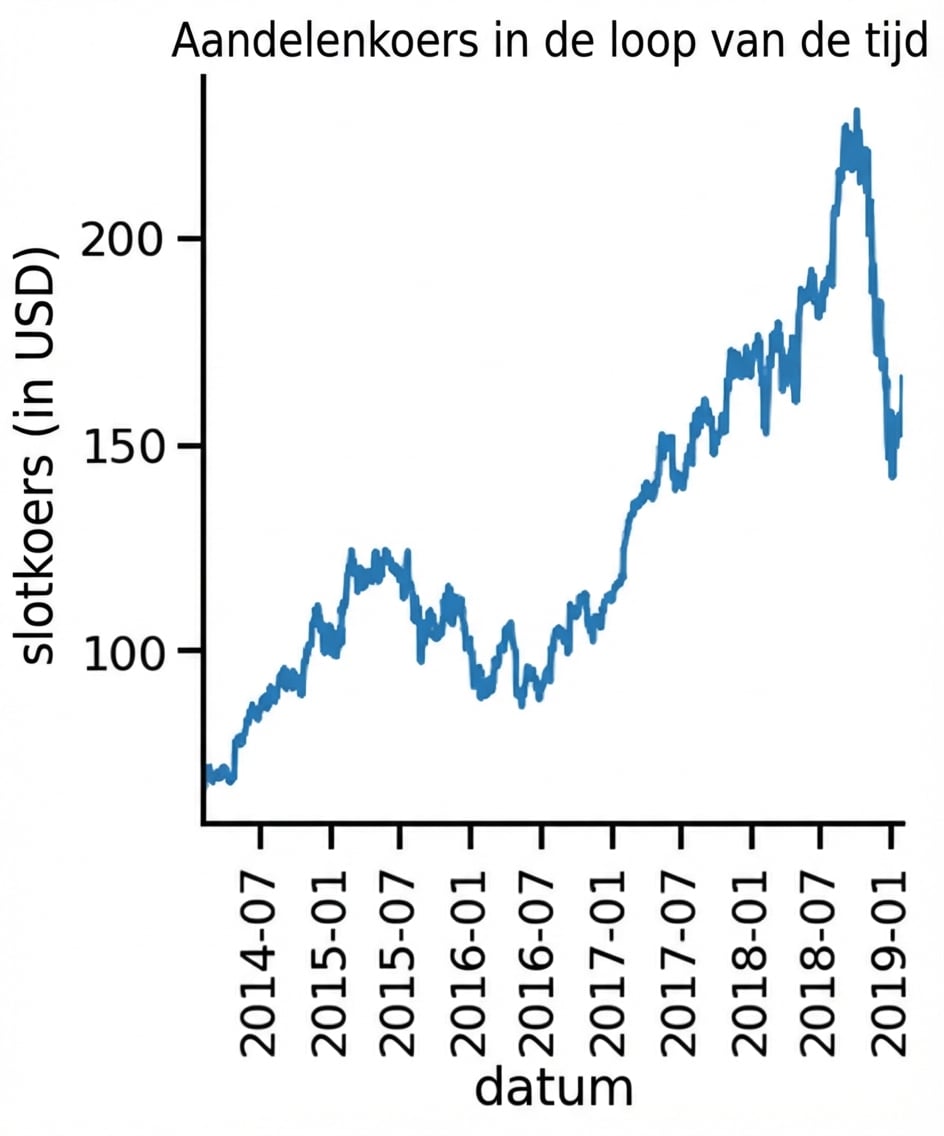
Wat zijn lijndiagrammen?
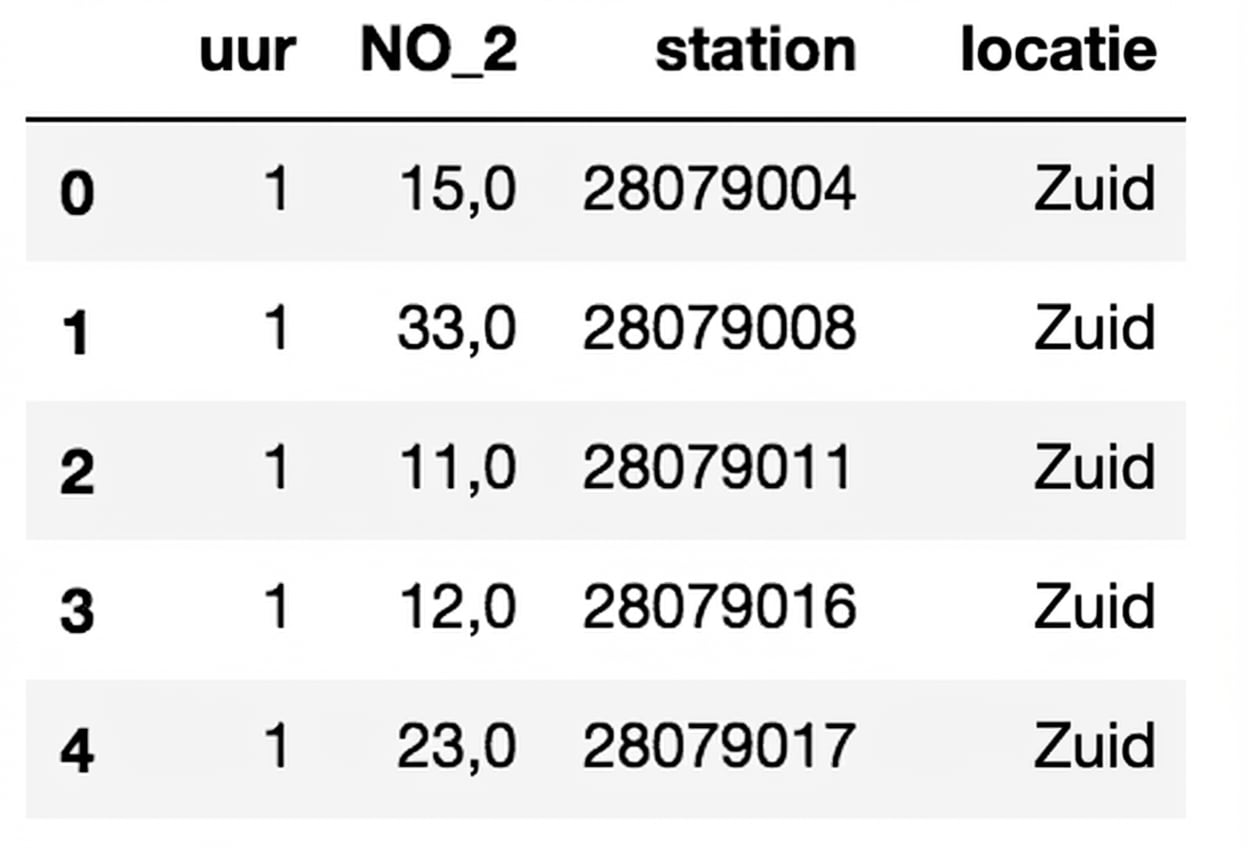
Luchtvervuilingsdata
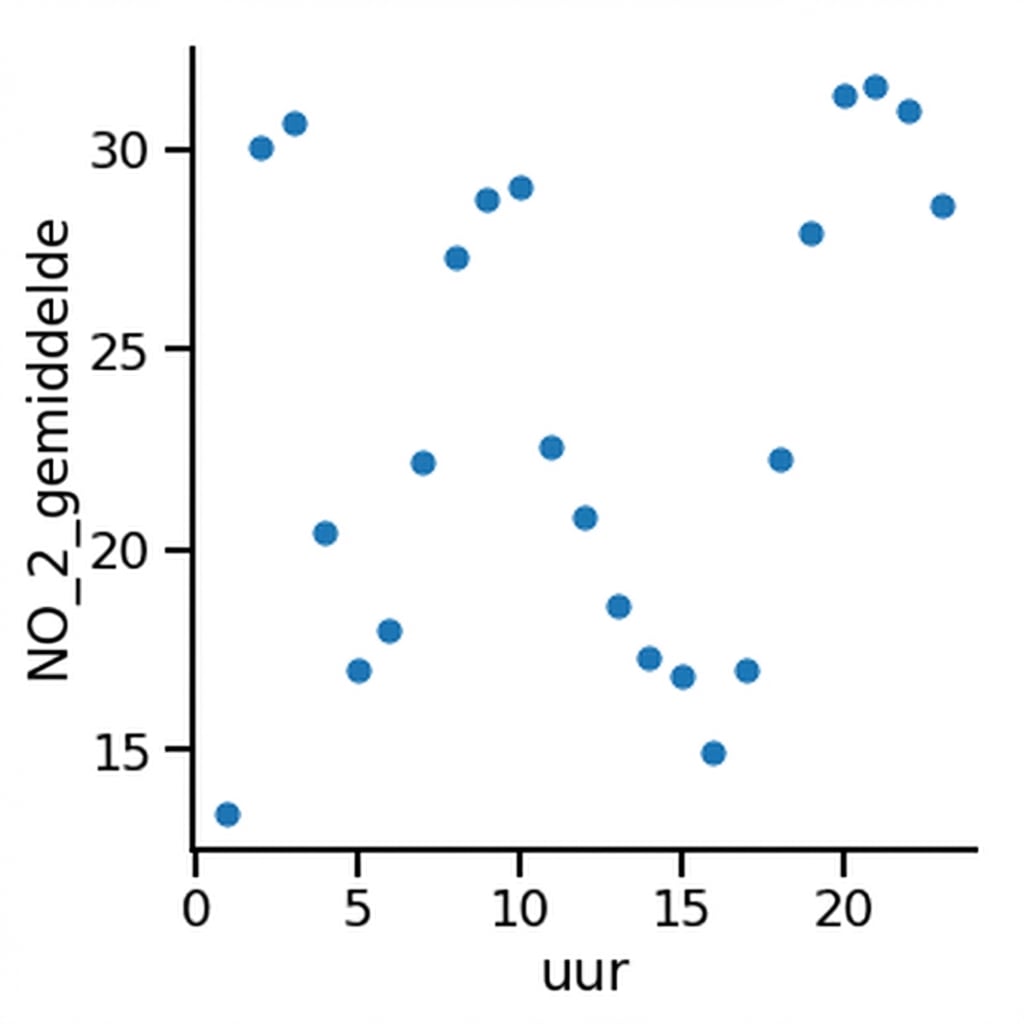
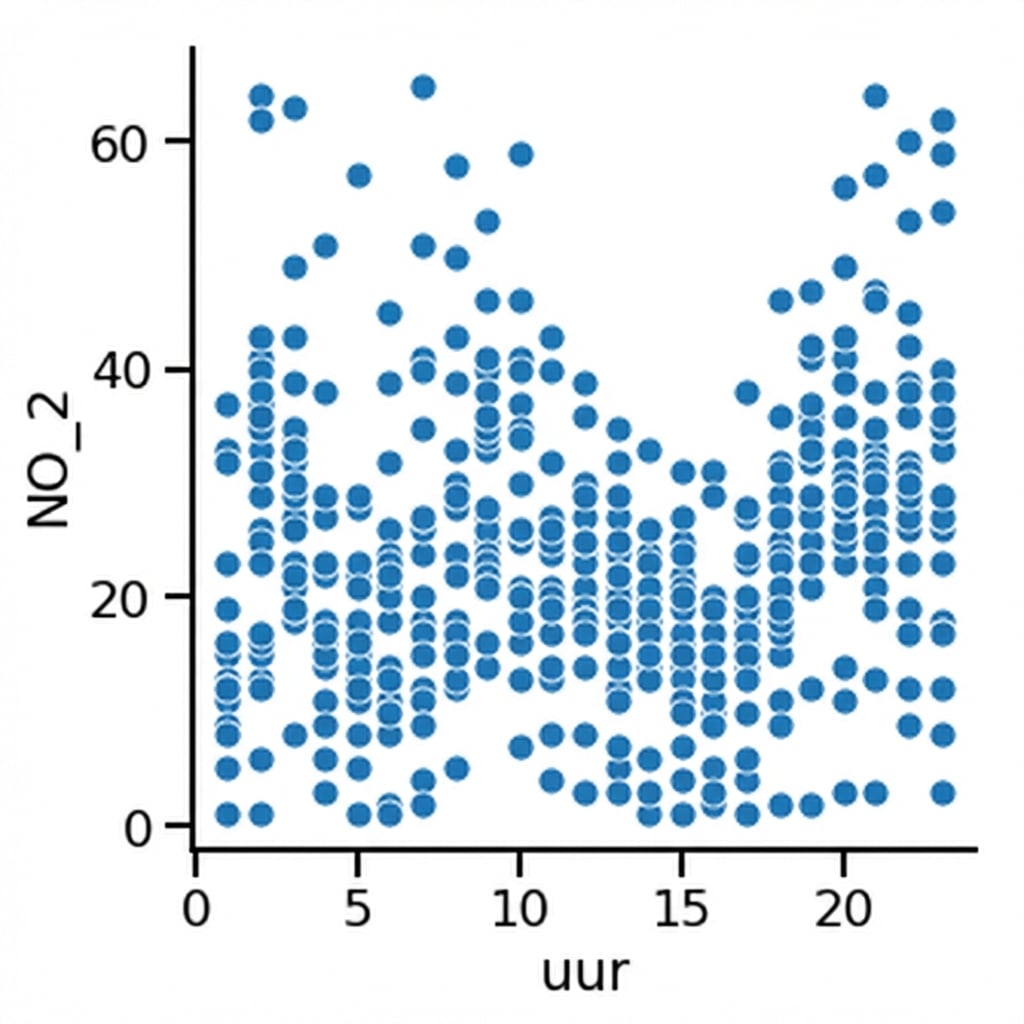
Spreidingsdiagram
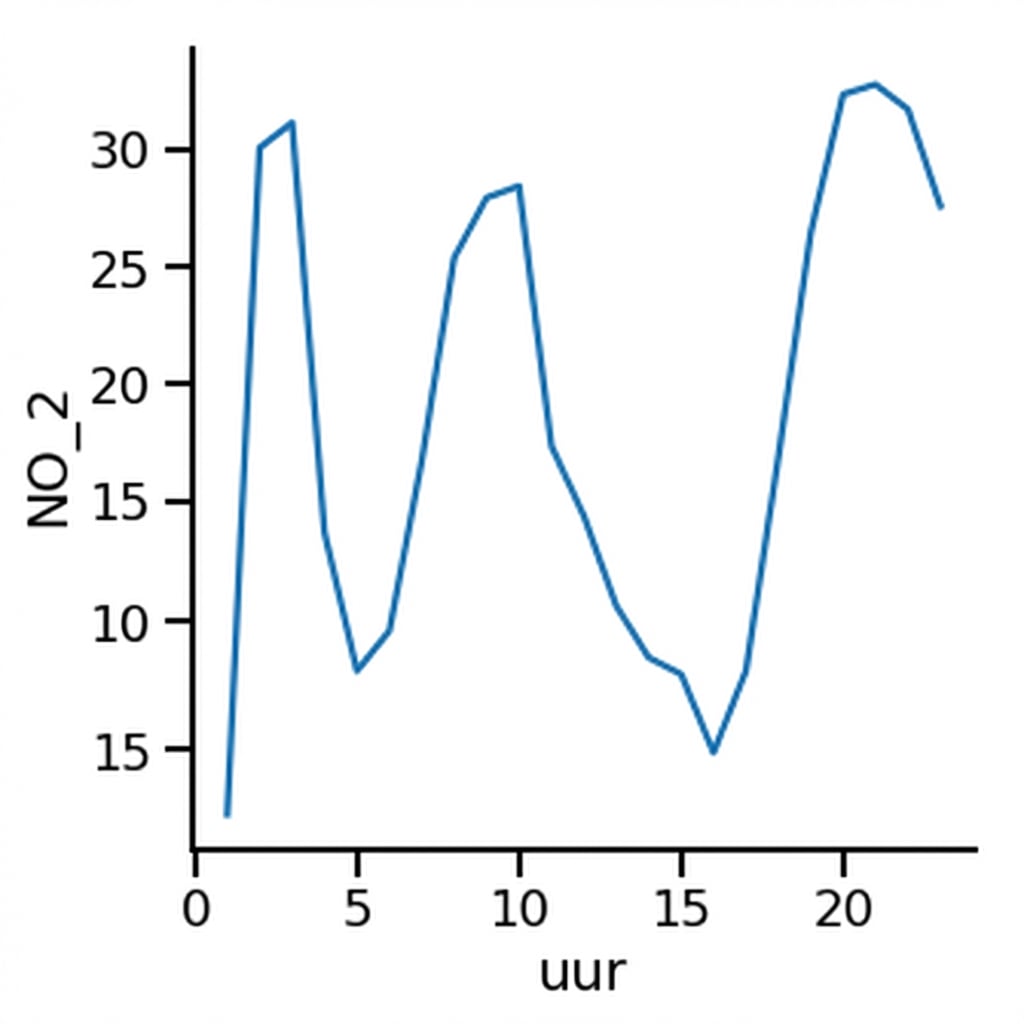
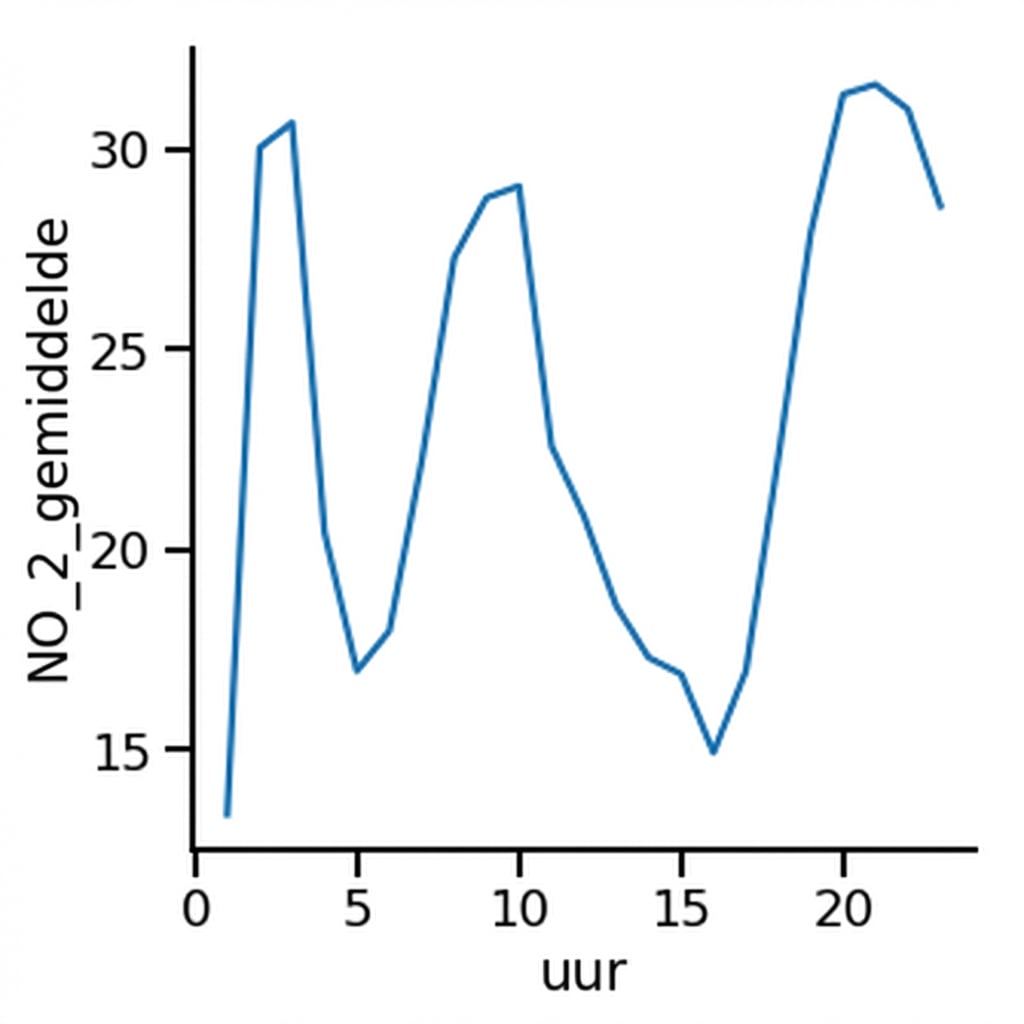
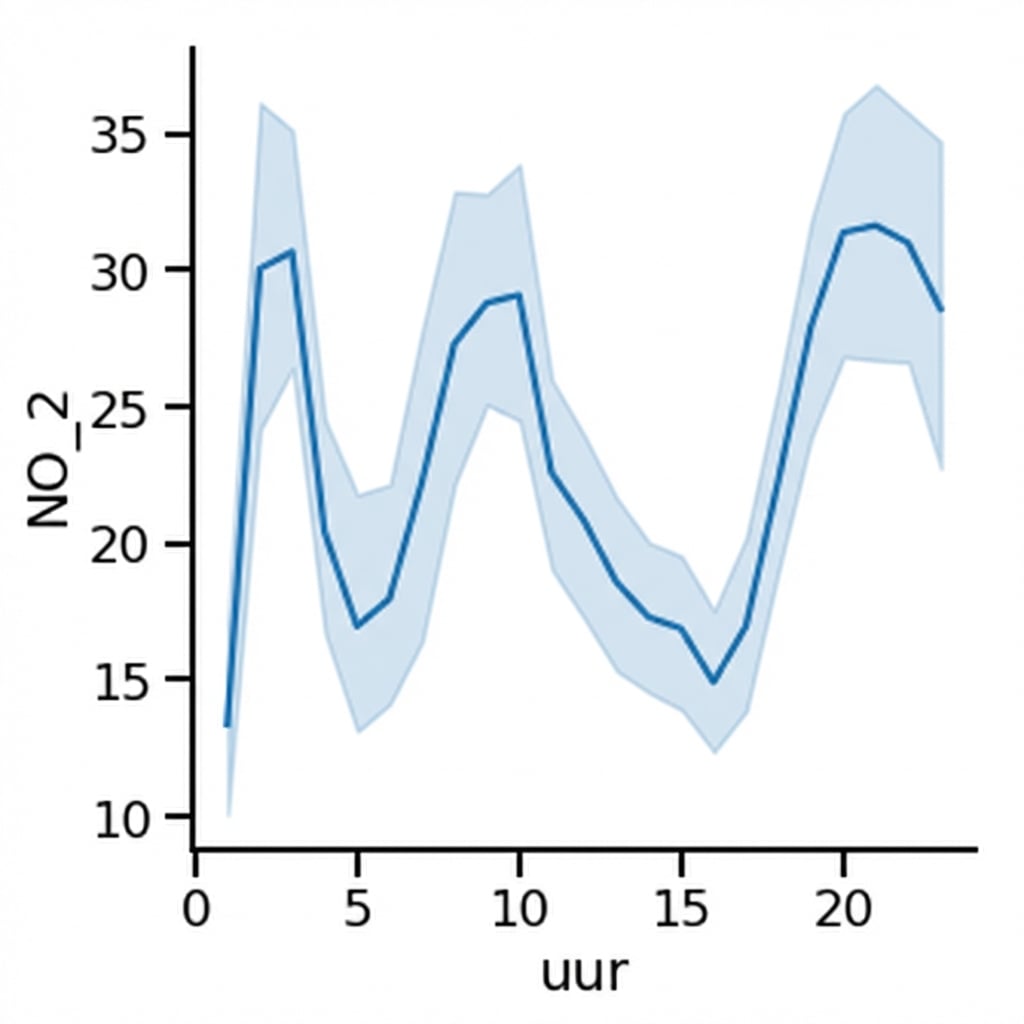
Lijndiagram
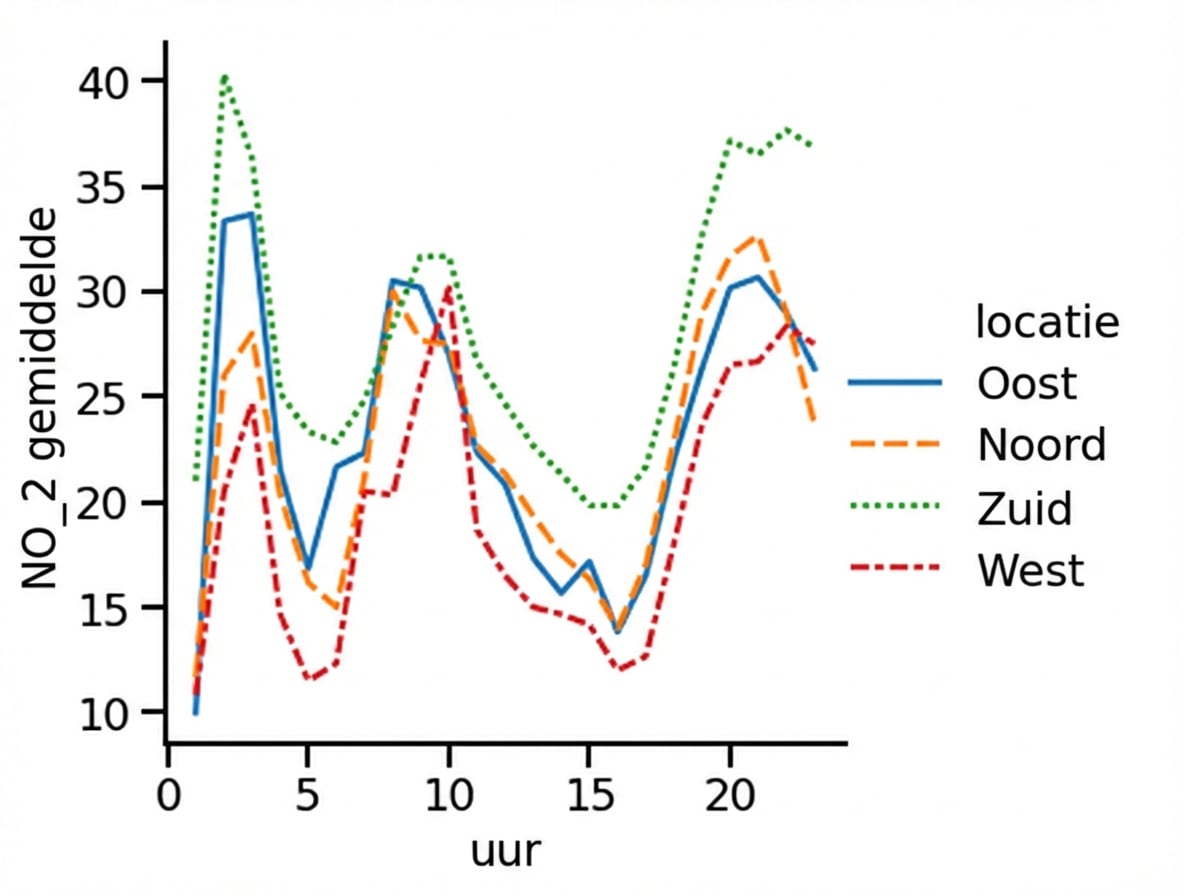
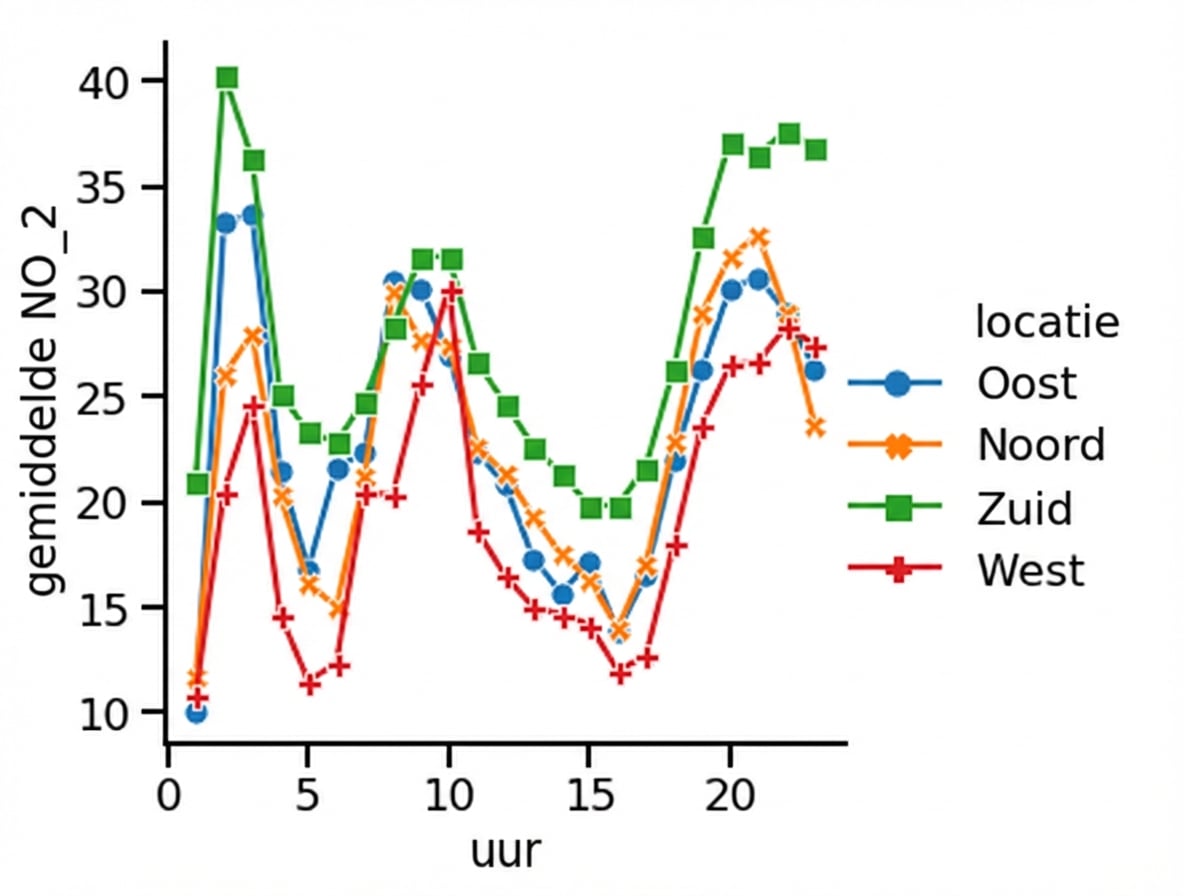
Subgroepen per locatie
Subgroepen per locatie
Markers toevoegen
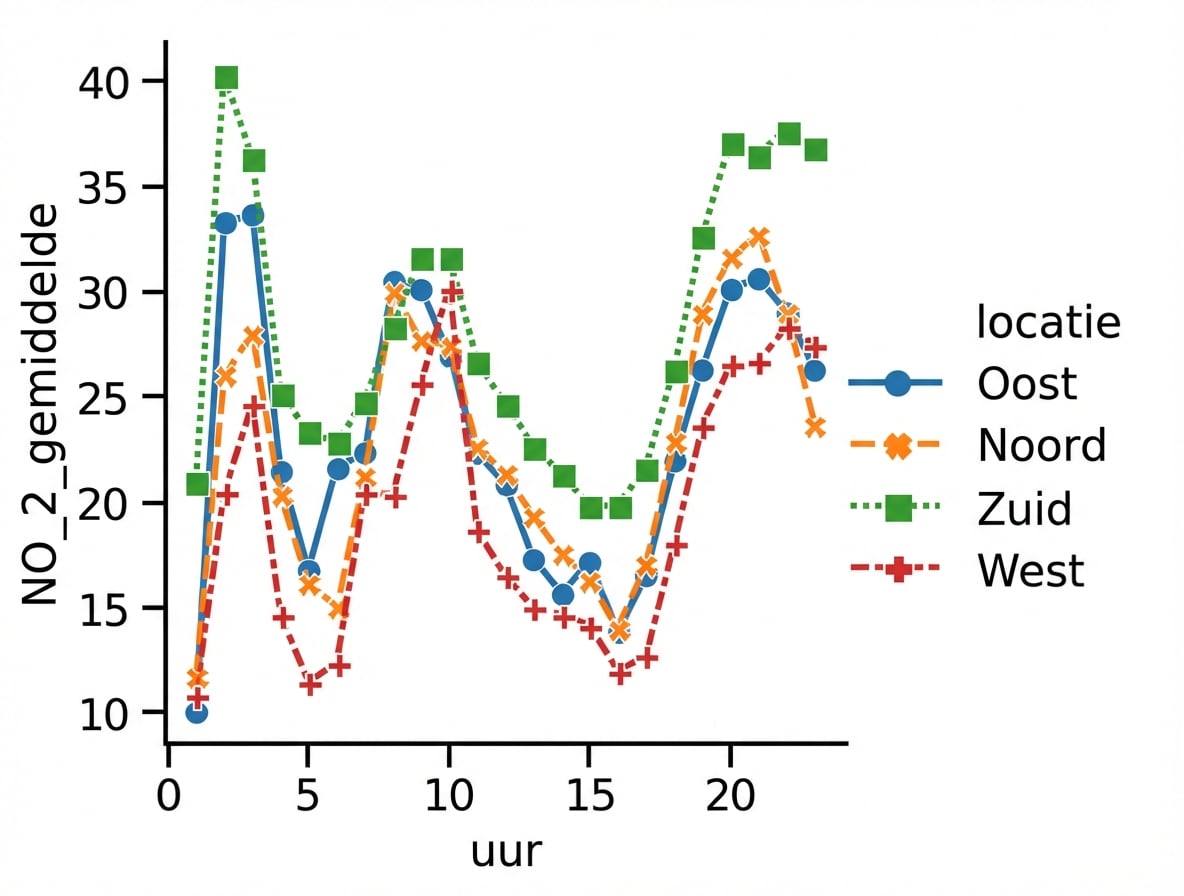
Lijnstijl uitschakelen
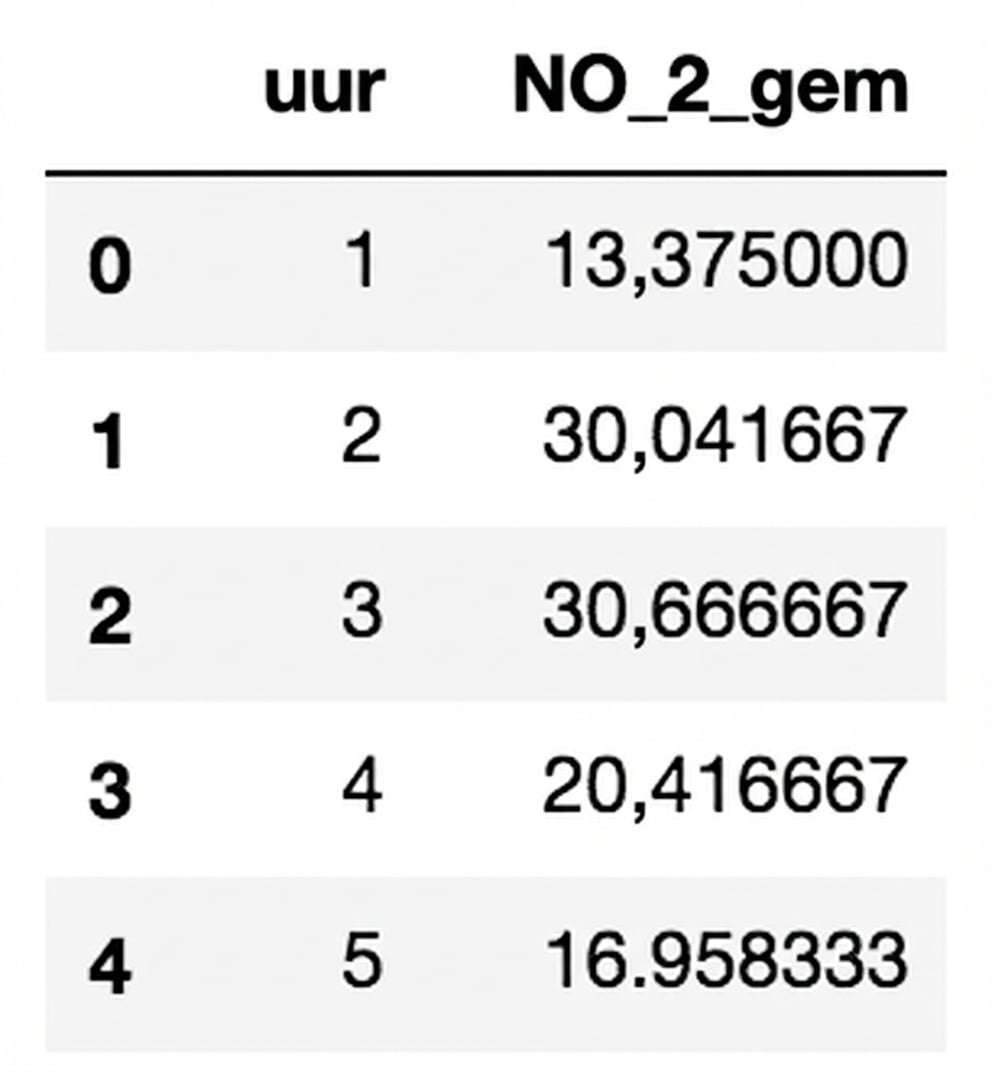
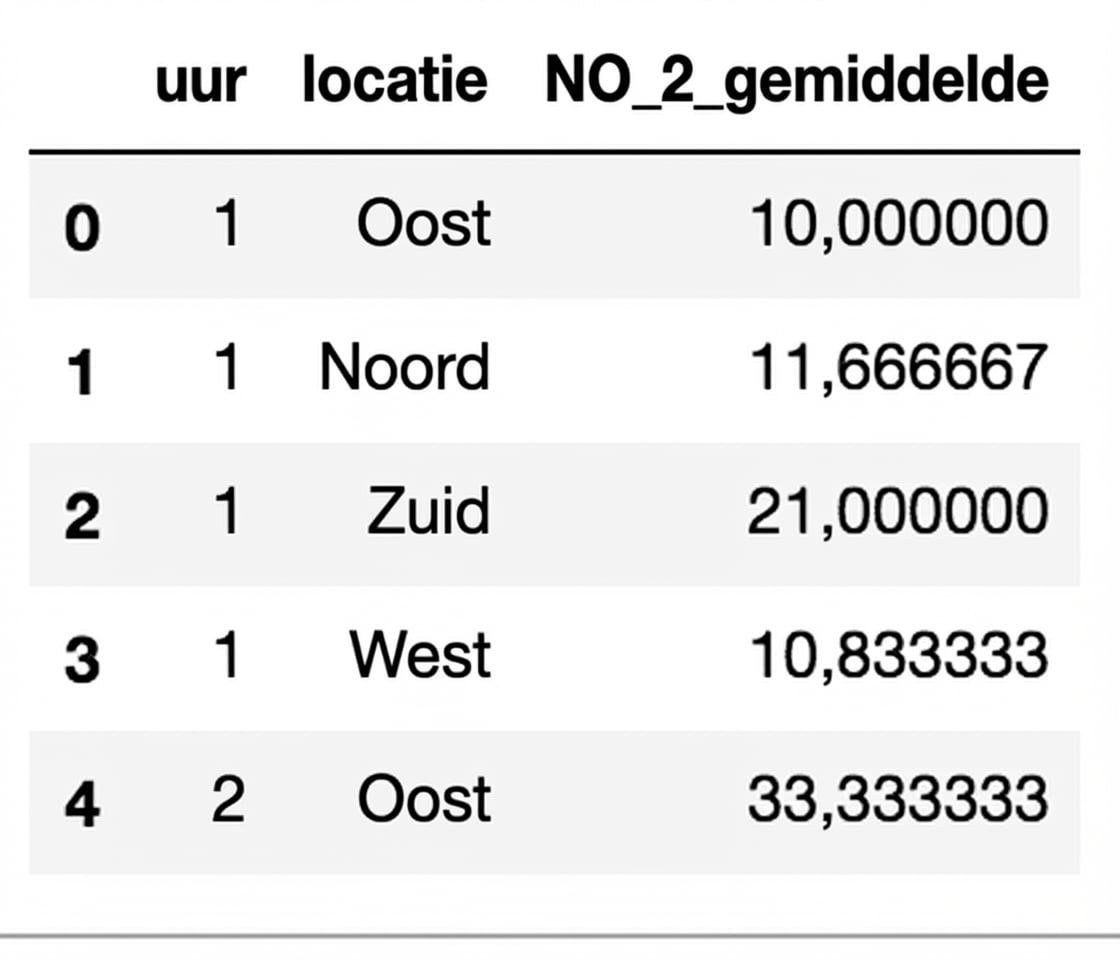
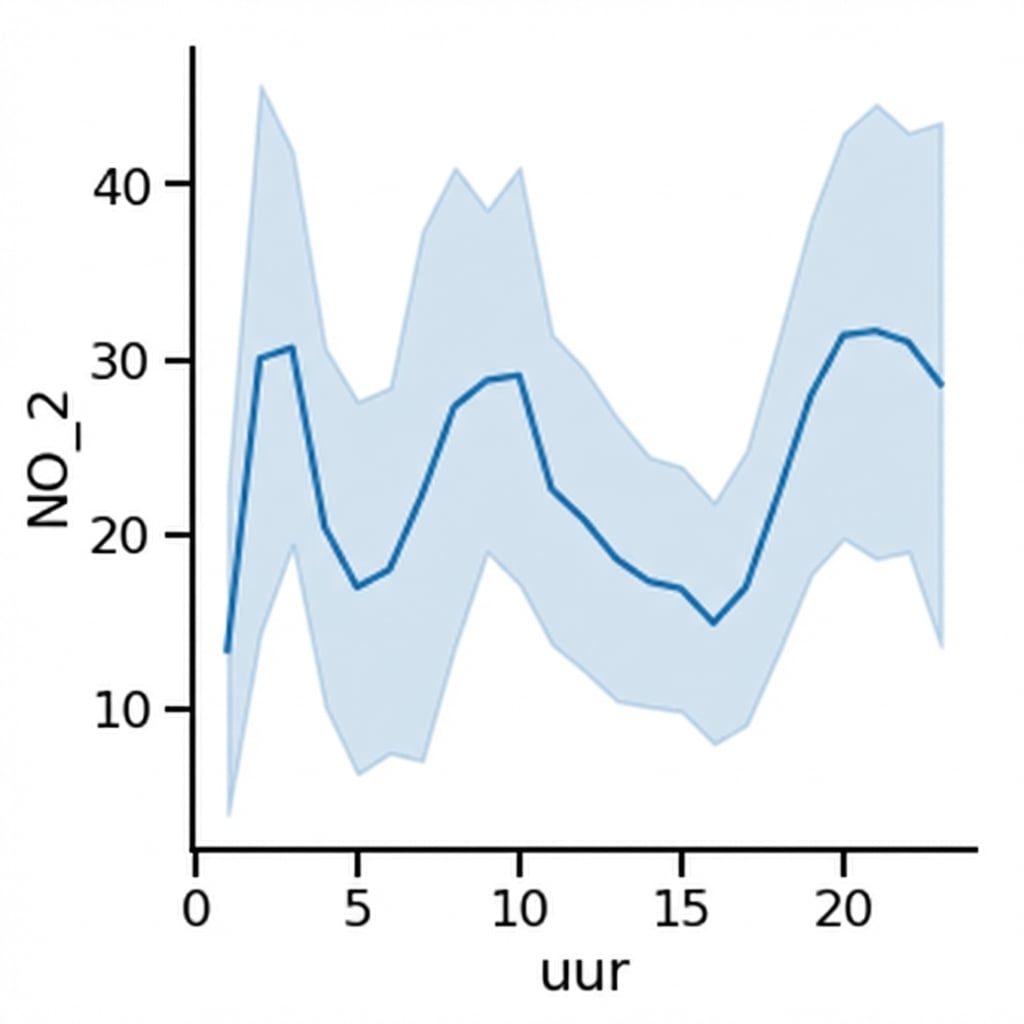
Meerdere observaties per x-waarde
Meerdere observaties per x-waarde
Meerdere observaties per x-waarde
Meerdere observaties per x-waarde
Betrouwbaarheidsinterval vervangen door standaarddeviatie
Betrouwbaarheidsinterval uitschakelen