Een boxplot maken
Introductie tot datavisualisatie met Seaborn

Content Team
DataCamp
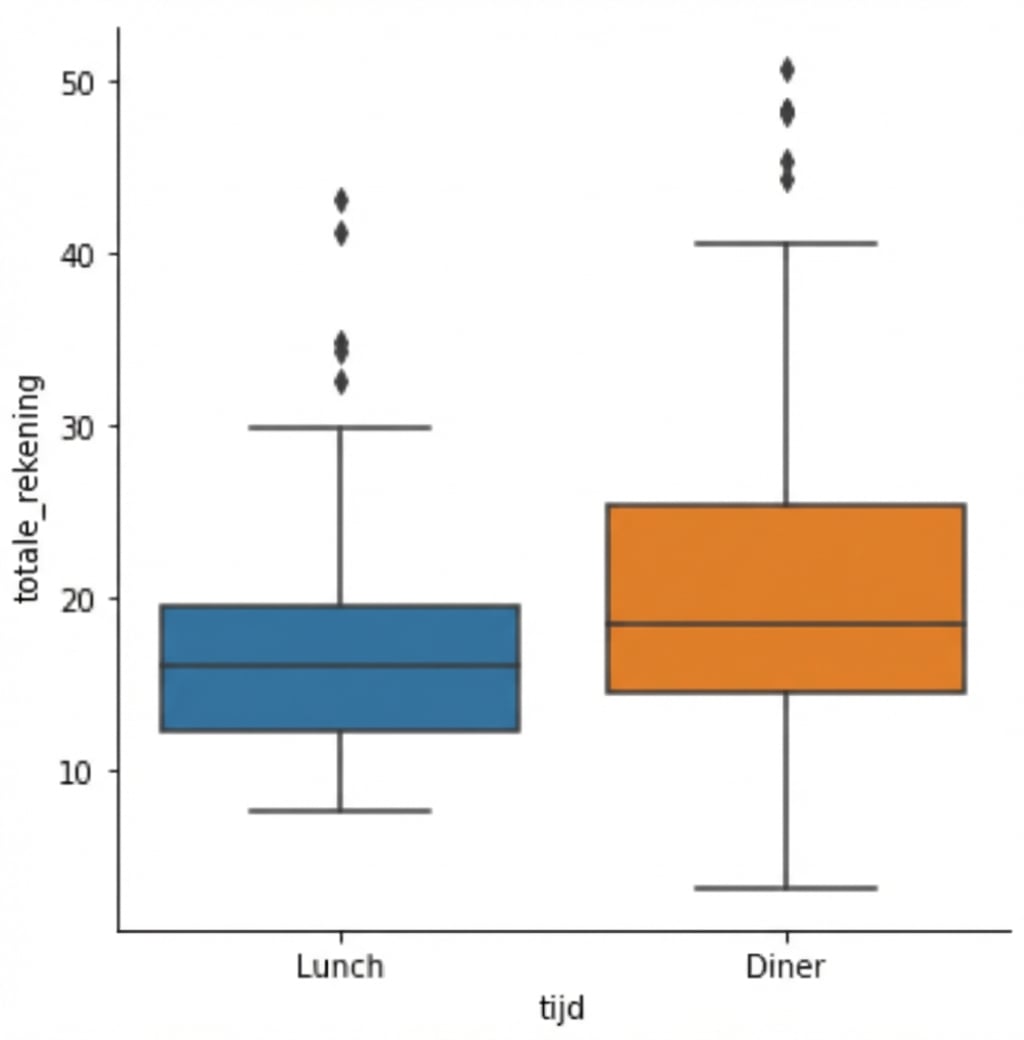
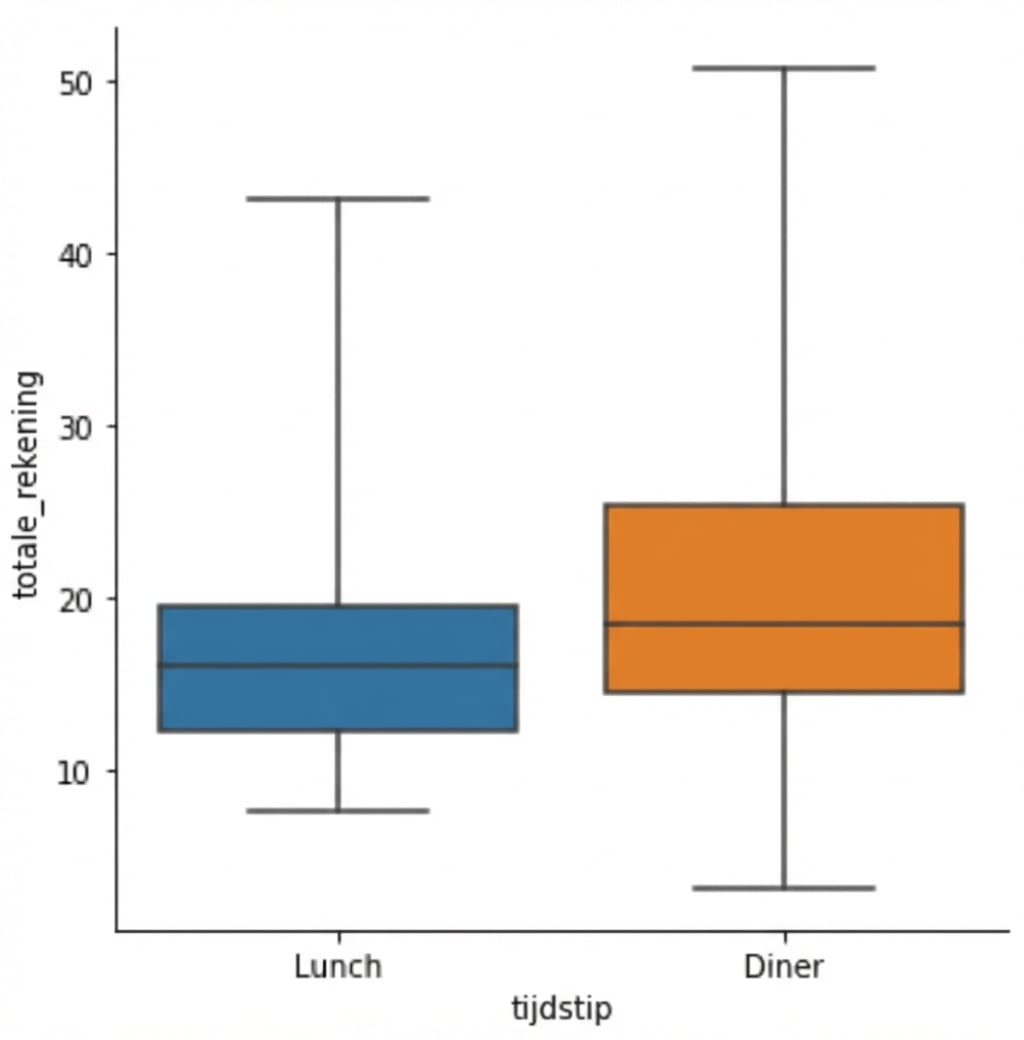
Wat is een boxplot?
1 Waskom, M. L. (2021). seaborn: statistical data visualization. https://seaborn.pydata.org/
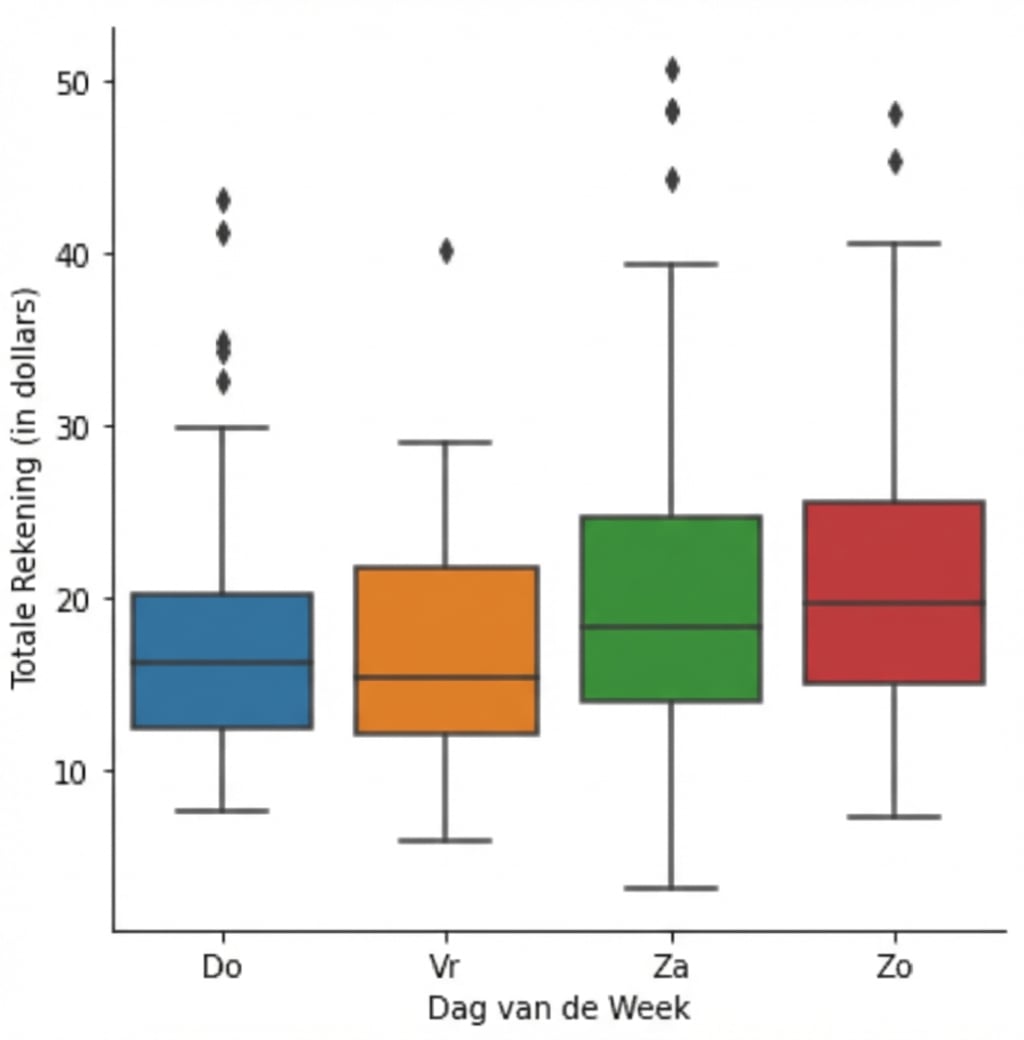
Een boxplot maken
1 Waskom, M. L. (2021). seaborn: statistical data visualization. https://seaborn.pydata.org/
Volgorde van categorieën wijzigen
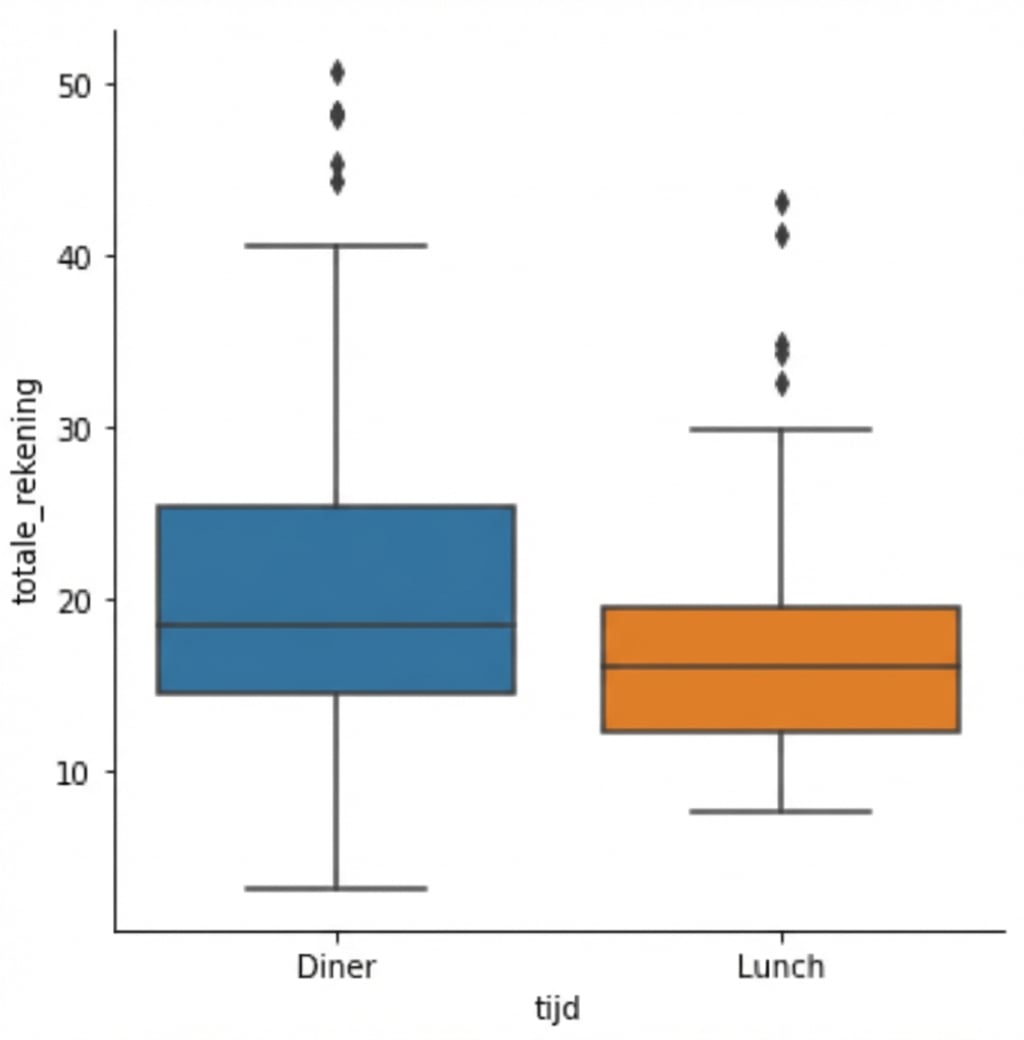
1 Waskom, M. L. (2021). seaborn: statistical data visualization. https://seaborn.pydata.org/
Buitenbeentjes weglaten
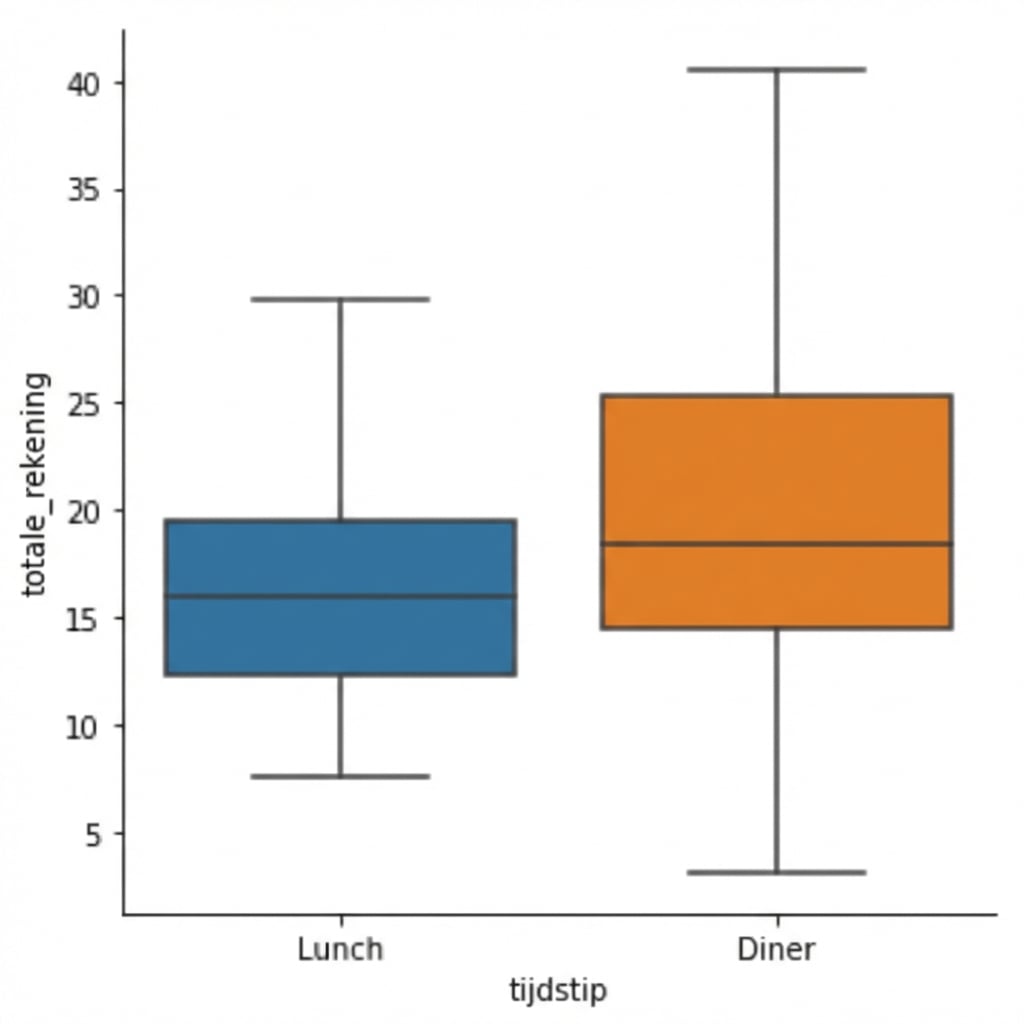
1 Waskom, M. L. (2021). seaborn: statistical data visualization. https://seaborn.pydata.org/
Snorren aanpassen met `whis`
1 Waskom, M. L. (2021). seaborn: statistical data visualization. https://seaborn.pydata.org/

