Alles combineren

Introductie tot datavisualisatie met Seaborn

Content Team

DataCamp

Aan de slag

Seaborn importeren:

import seaborn as sns

Matplotlib importeren:

import matplotlib.pyplot as plt

Een plot tonen:

plt.show()
Introductie tot datavisualisatie met Seaborn

Relationele plots

  • Toont de relatie tussen twee kwantitatieve variabelen
  • Voorbeelden: scatterplots, lijndiagrammen
sns.relplot(x="x_variable_name", 
            y="y_variable_name", 
            data=pandas_df, 
            kind="scatter")
Introductie tot datavisualisatie met Seaborn

Categorische plots

  • Toont de verdeling van een kwantitatieve variabele binnen categorieën van een categorische variabele
  • Voorbeelden: staafdiagrammen, countplots, boxplots, pointplots
sns.catplot(x="x_variable_name", 
            y="y_variable_name", 
            data=pandas_df, 
            kind="bar")
Introductie tot datavisualisatie met Seaborn

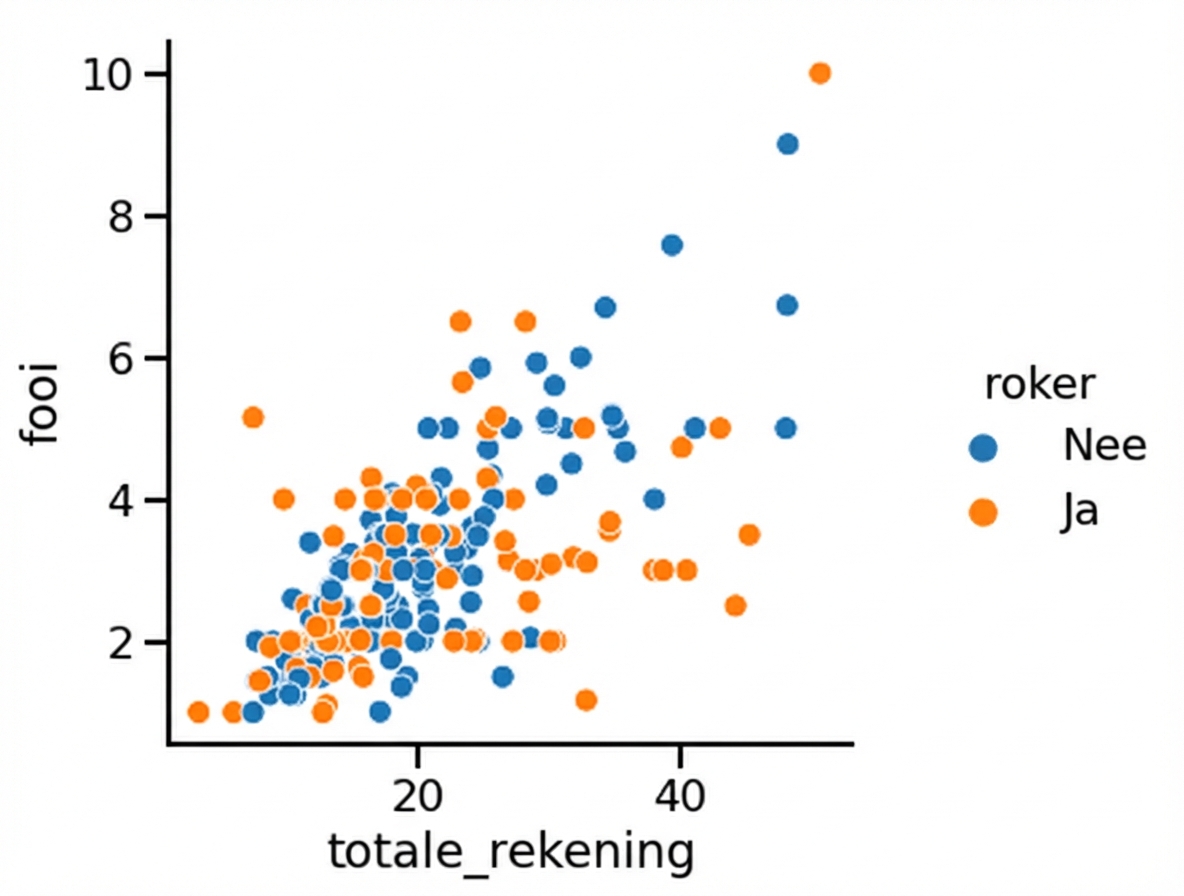
Een derde variabele toevoegen (hue)

hue instellen maakt subgroepen die als verschillende kleuren in één plot verschijnen.

Spreidingsdiagram met hue

1 Waskom, M. L. (2021). seaborn: statistical data visualization. https://seaborn.pydata.org/
Introductie tot datavisualisatie met Seaborn

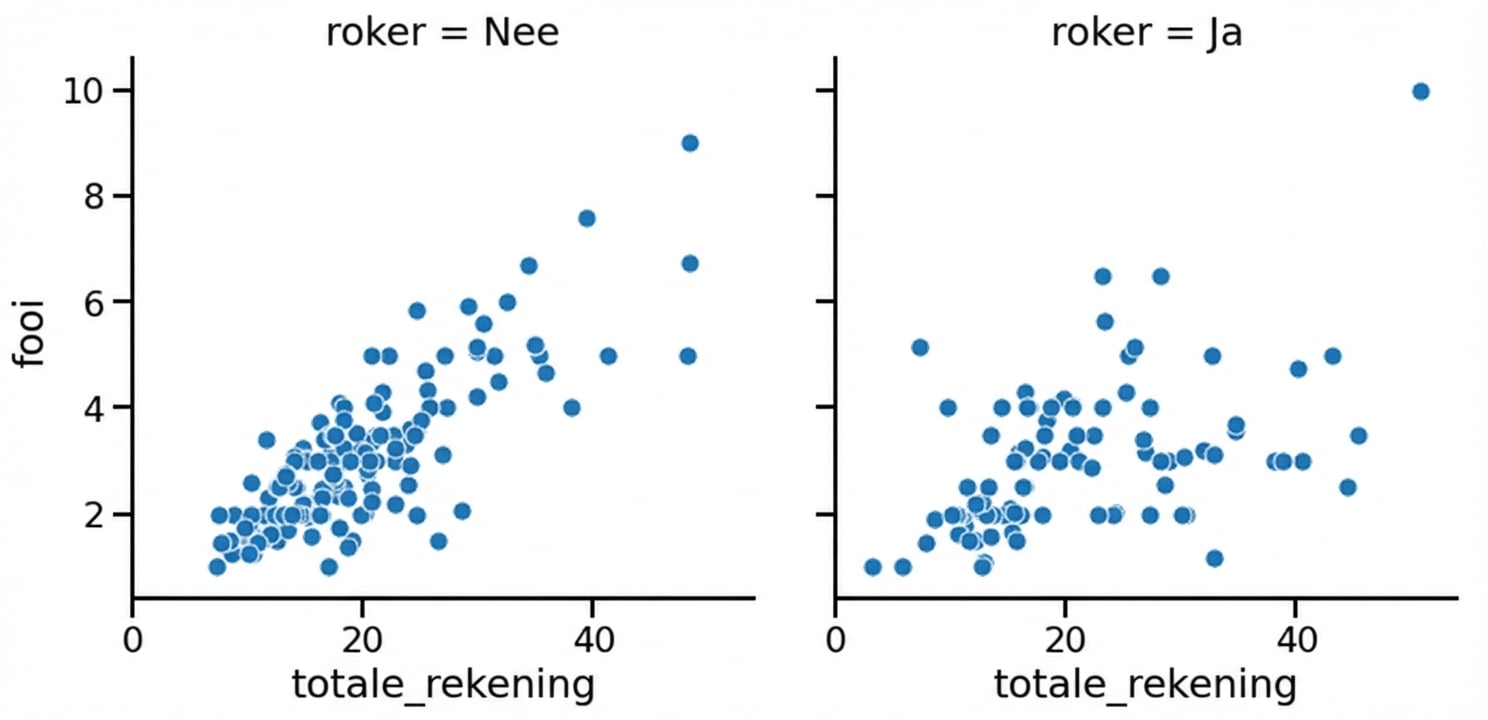
Een derde variabele toevoegen (row/col)

row en/of col instellen in relplot() of catplot() maakt subgroepen die in aparte subplots staan.

Spreidingsdiagram met subplots

1 Waskom, M. L. (2021). seaborn: statistical data visualization. https://seaborn.pydata.org/
Introductie tot datavisualisatie met Seaborn

Aanpassen

  • Achtergrond wijzigen: sns.set_style()
  • Kleuren van hoofdelementen: sns.set_palette()
  • Schaal aanpassen: sns.set_context()
Introductie tot datavisualisatie met Seaborn

Een titel toevoegen

Objecttype Plottypen Titel toevoegen
FacetGrid relplot(), catplot() g.figure.suptitle()
AxesSubplot scatterplot(), countplot(), enz. g.set_title()
Introductie tot datavisualisatie met Seaborn

Laatste details

Voeg x- en y-aslabels toe:

g.set(xlabel="new x-axis label",
      ylabel="new y-axis label")

Draai x-ticklabels:

plt.xticks(rotation=90)
Introductie tot datavisualisatie met Seaborn

Laten we oefenen!

Introductie tot datavisualisatie met Seaborn

Preparing Video For Download...