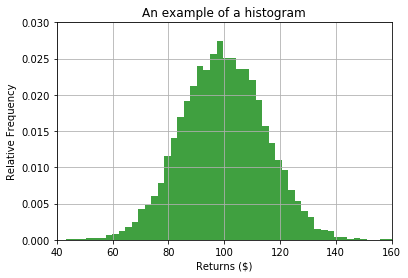
Histogrammen
Introductie tot Python voor Finance

Adina Howe
Professor
Waarom histogrammen voor financiële analyse?
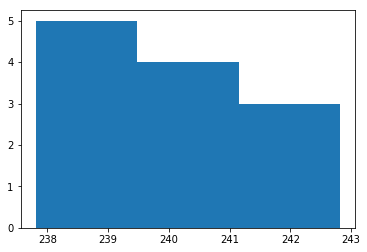
Histogrammen en matplotlib.pyplot
import matplotlib.pyplot as plt
plt.hist(x=prices, bins=3)
plt.show()
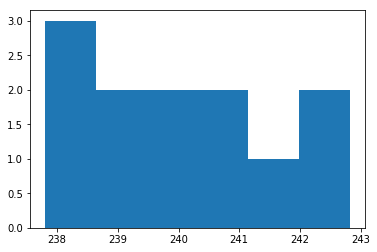
Het aantal bins wijzigen
import matplotlib.pyplot as plt
plt.hist(prices, bins=6)
plt.show()
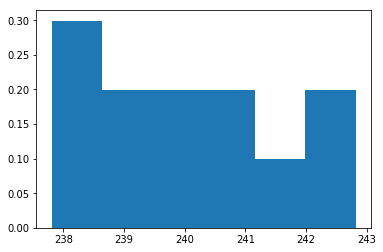
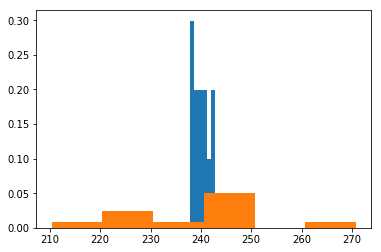
Histogramdata normaliseren
import matplotlib.pyplot as plt
plt.hist(prices, bins=6, density=True)
plt.show()
Resultaat histogram
Resultaat histogram
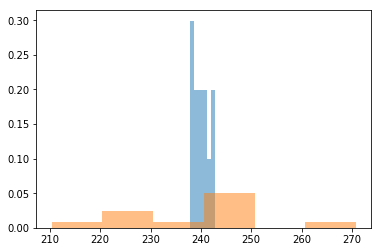
Resultaat histogram


