Visualiseren in Python
Introductie tot Python voor Finance

Adina Howe
Professor
Matplotlib: een visualisatiepakket
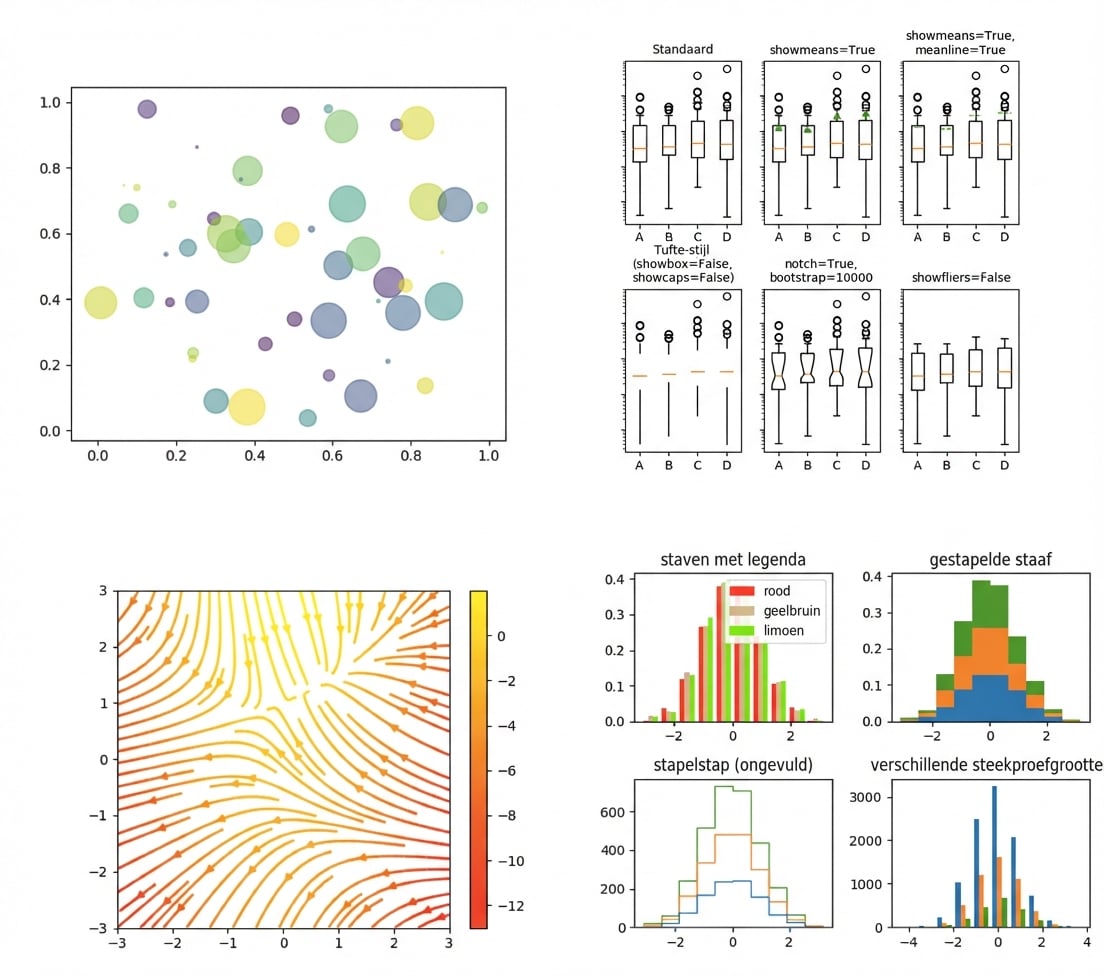
Bekijk meer van de Matplotlib-galerij via deze link.
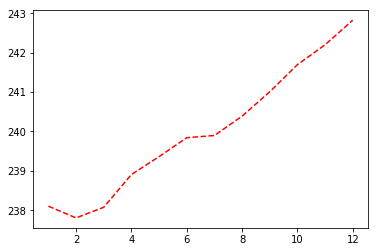
Plotresultaat
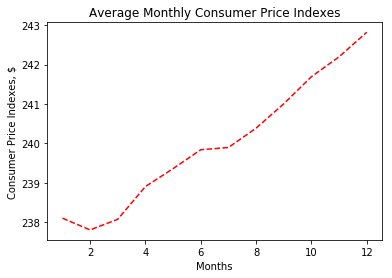
Plotresultaat
Plotresultaat
Plotresultaat
Plotresultaat
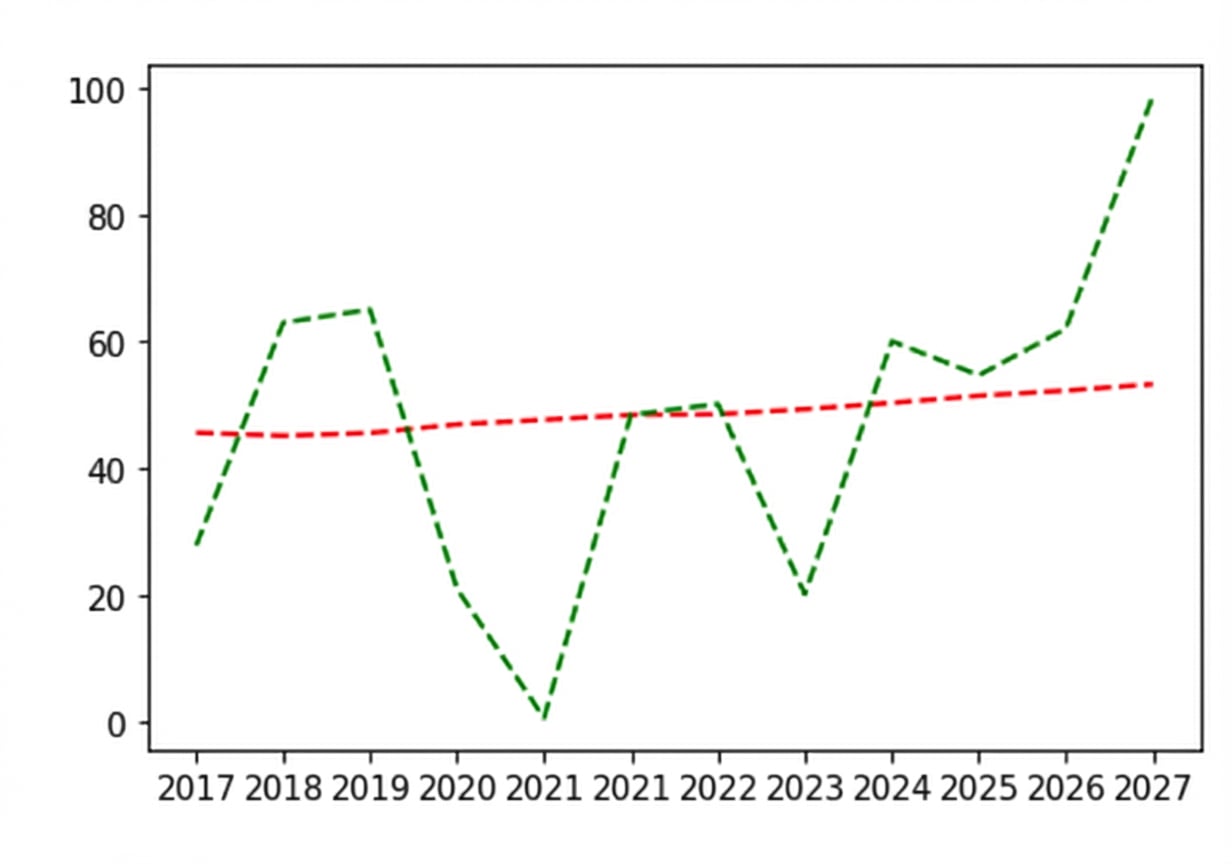
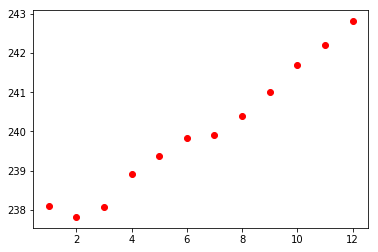
Spreidingsdiagram-resultaat