Een verhaal van twee variabelen
Introductie tot regressie in R

Richie Cotton
Data Evangelist at DataCamp
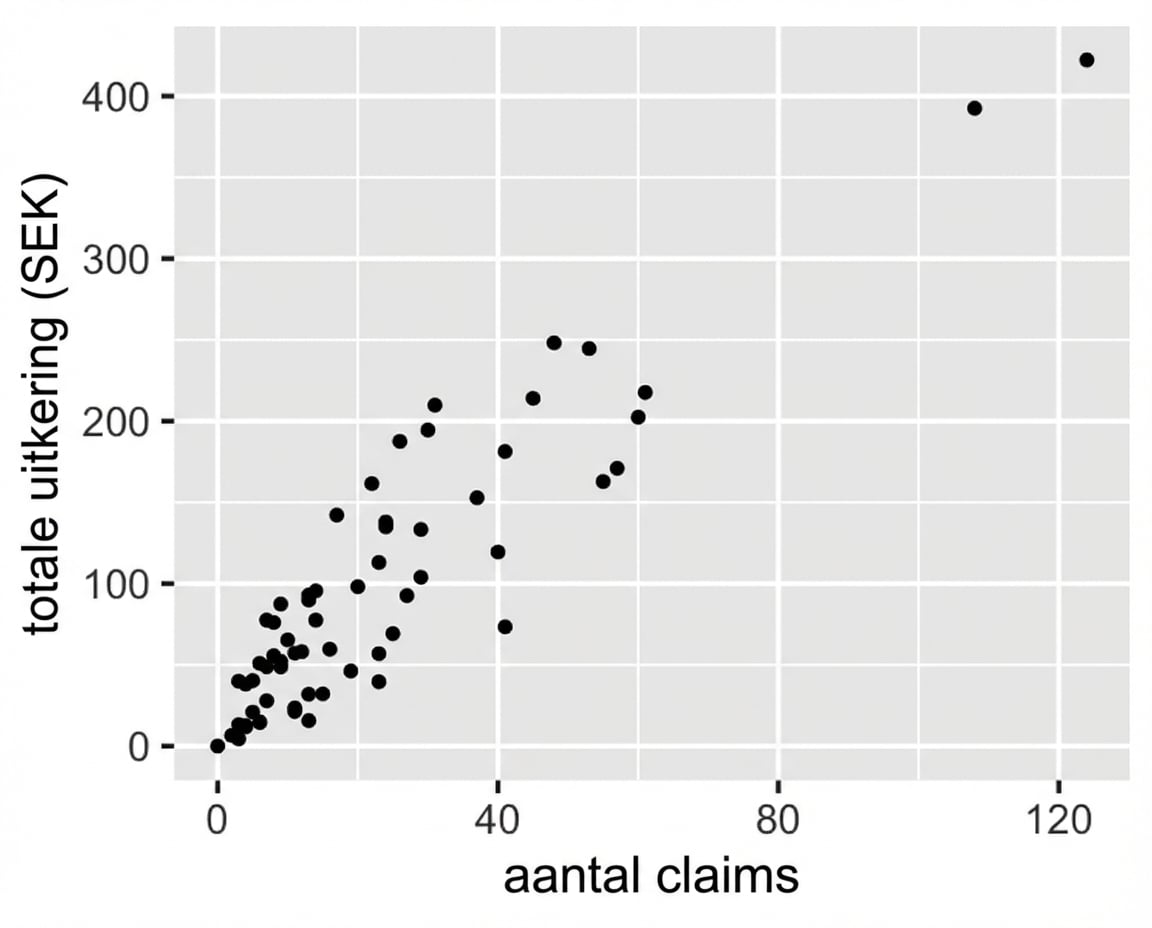
Parenvan variabelen visualiseren
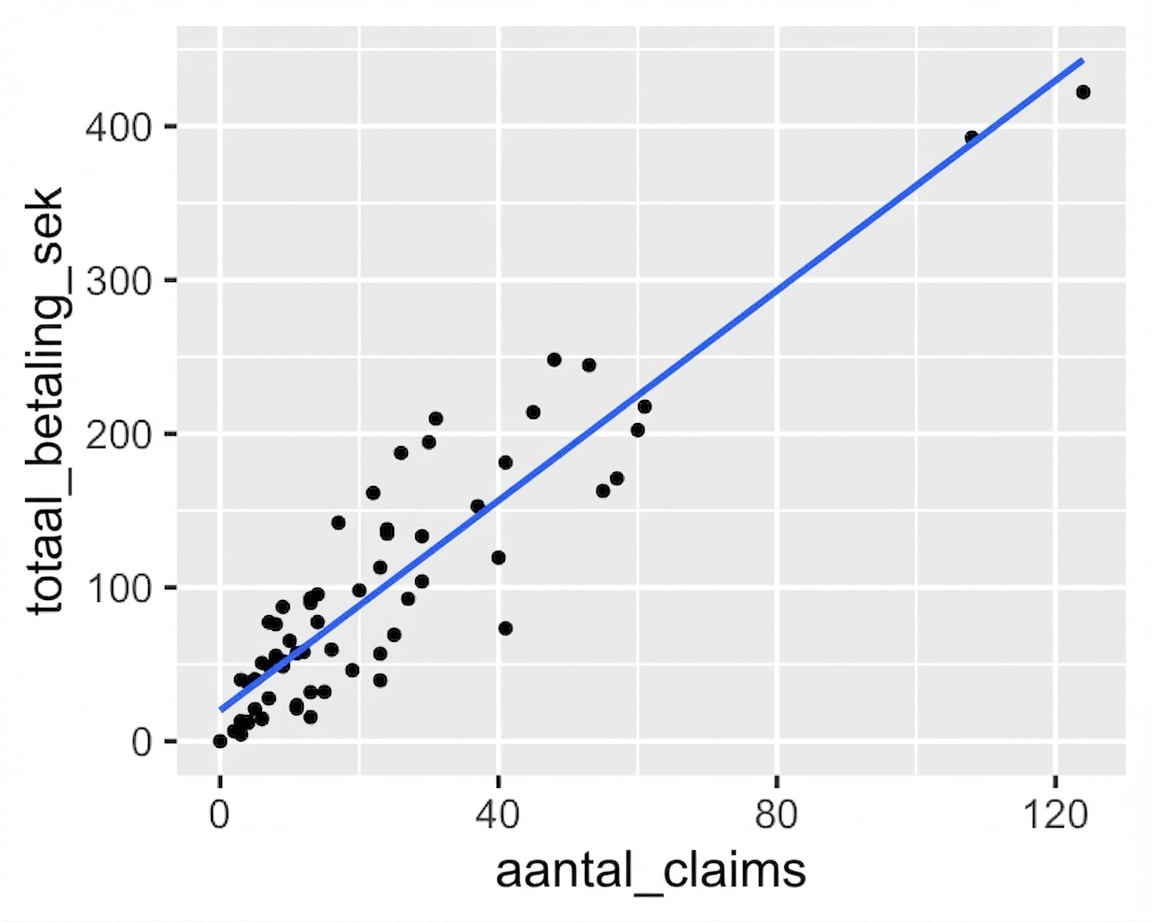
Een lineaire trendlijn toevoegen
Introductie tot regressie in R
Richie Cotton
Data Evangelist at DataCamp

