Een verhaal van twee variabelen
Introductie tot regressie met statsmodels in Python

Maarten Van den Broeck
Content Developer at DataCamp
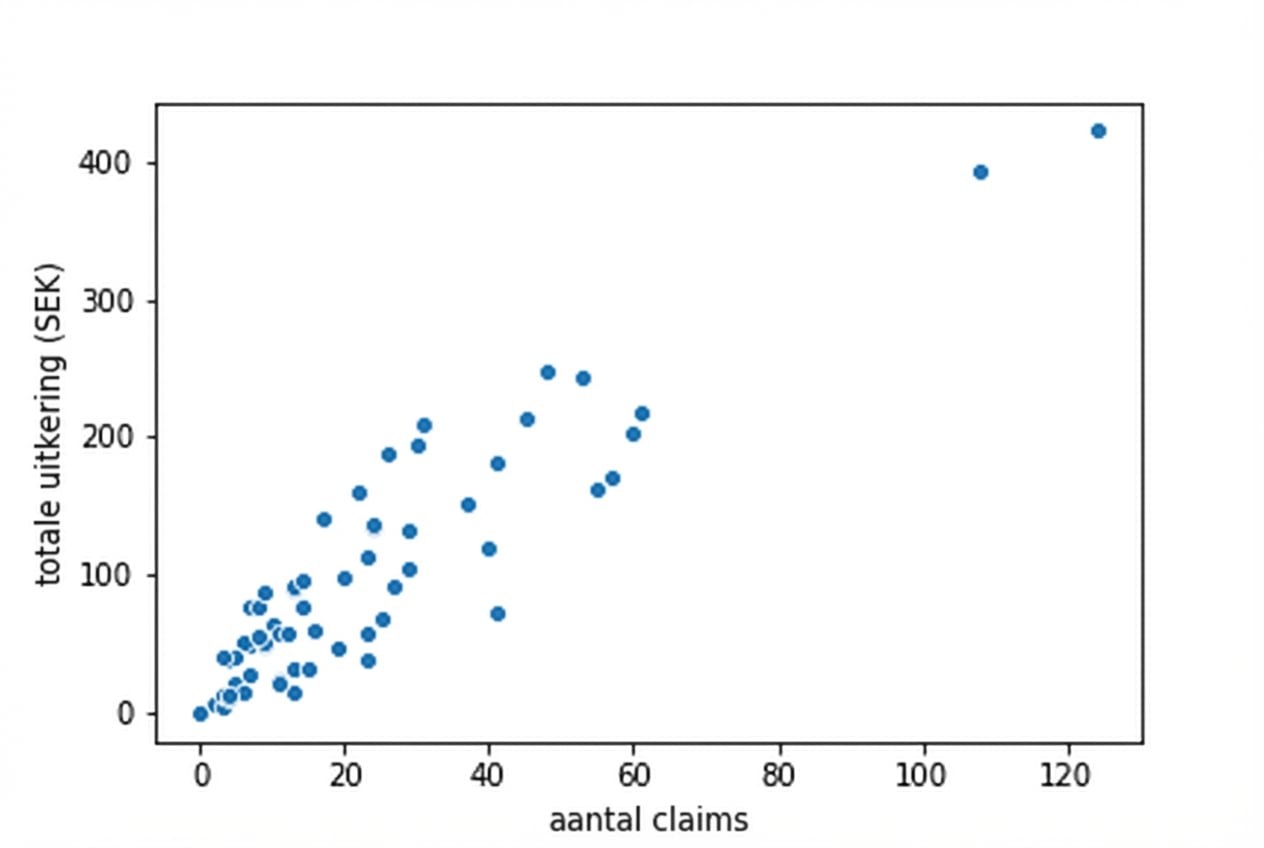
Paren van variabelen visualiseren
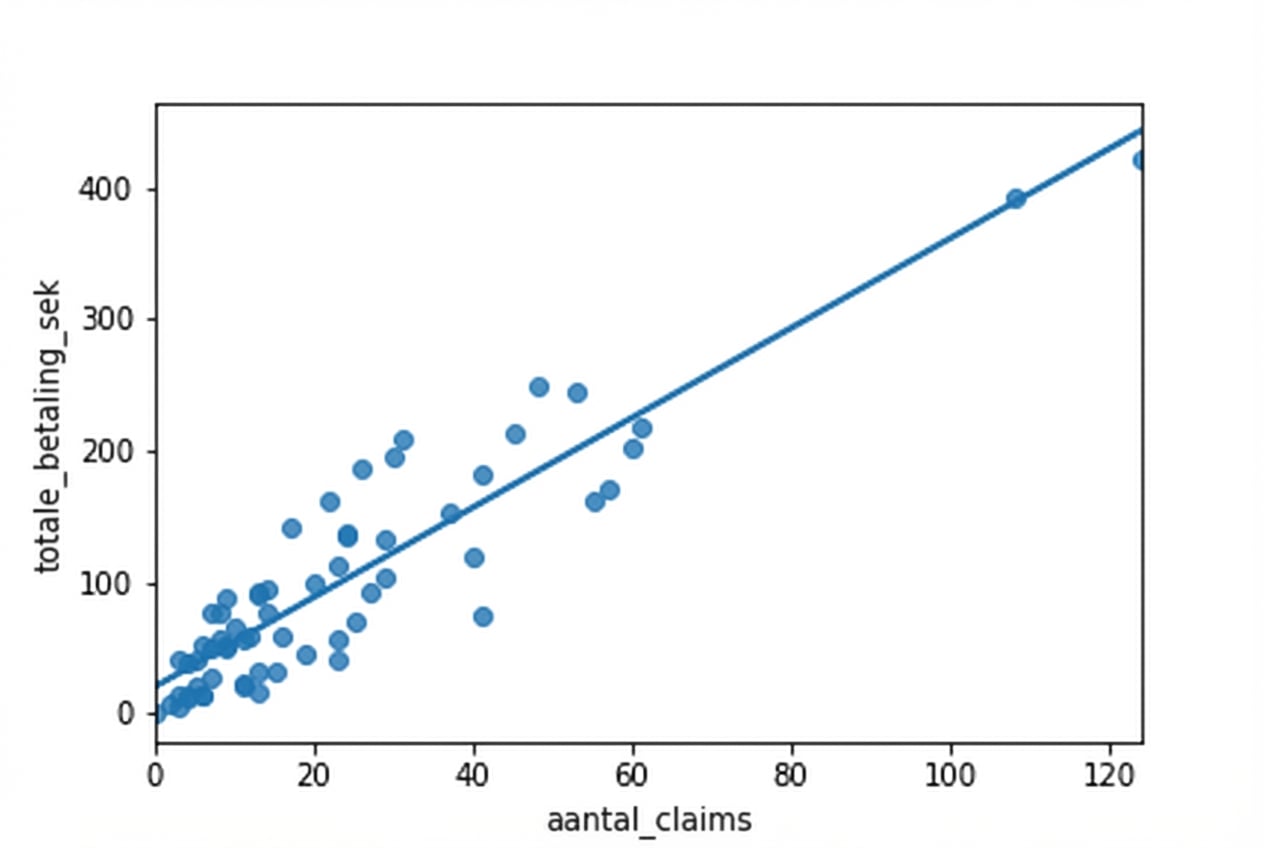
Een lineaire trendlijn toevoegen
Introductie tot regressie met statsmodels in Python
Maarten Van den Broeck
Content Developer at DataCamp

