Uitschieters, leverage en invloed
Introductie tot regressie met statsmodels in Python

Maarten Van den Broeck
Content Developer at DataCamp
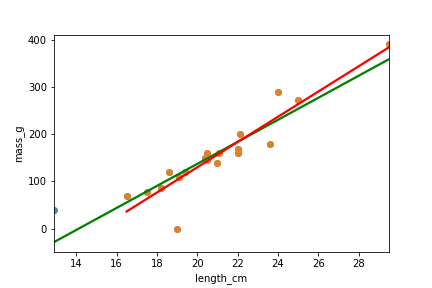
Roach-dataset

Welke punten zijn uitschieters?
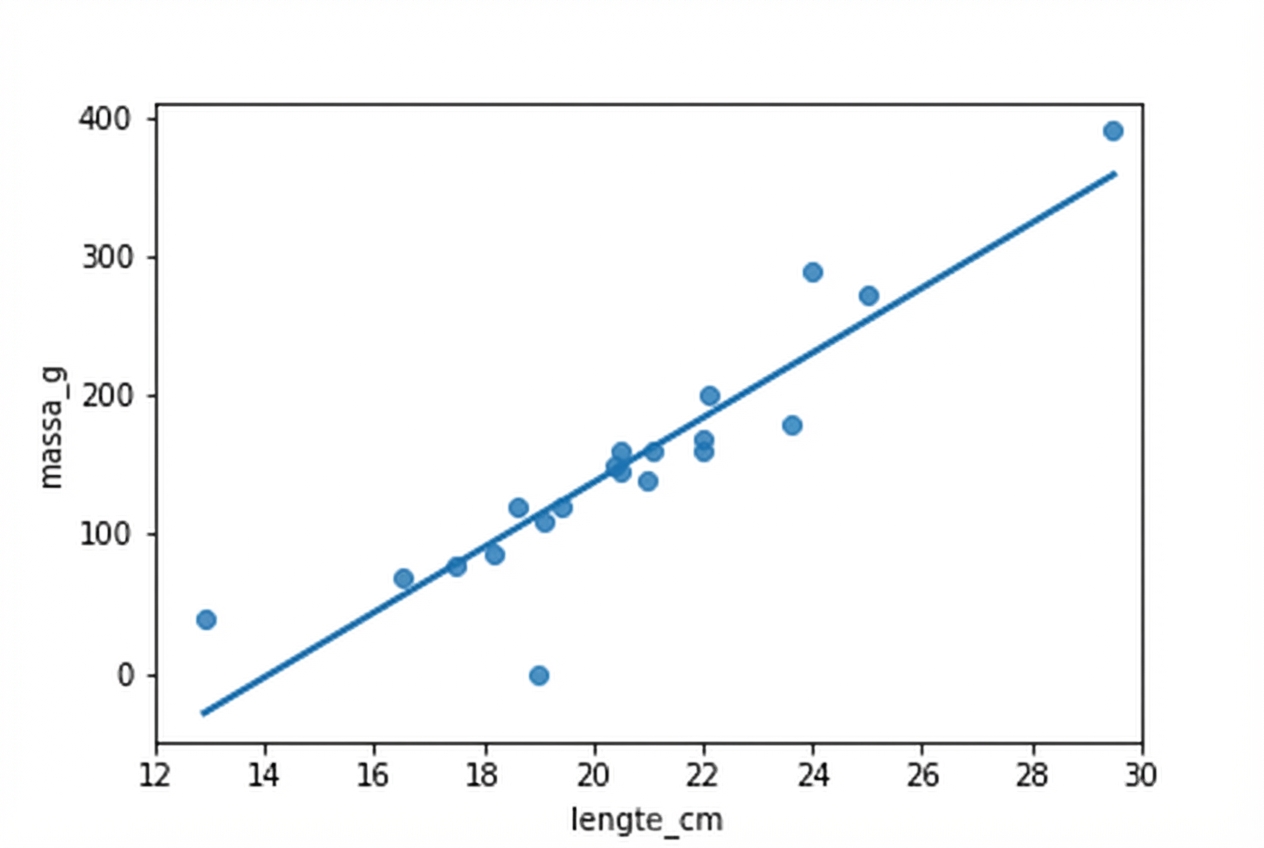
Extreme waarden van de verklarende variabele
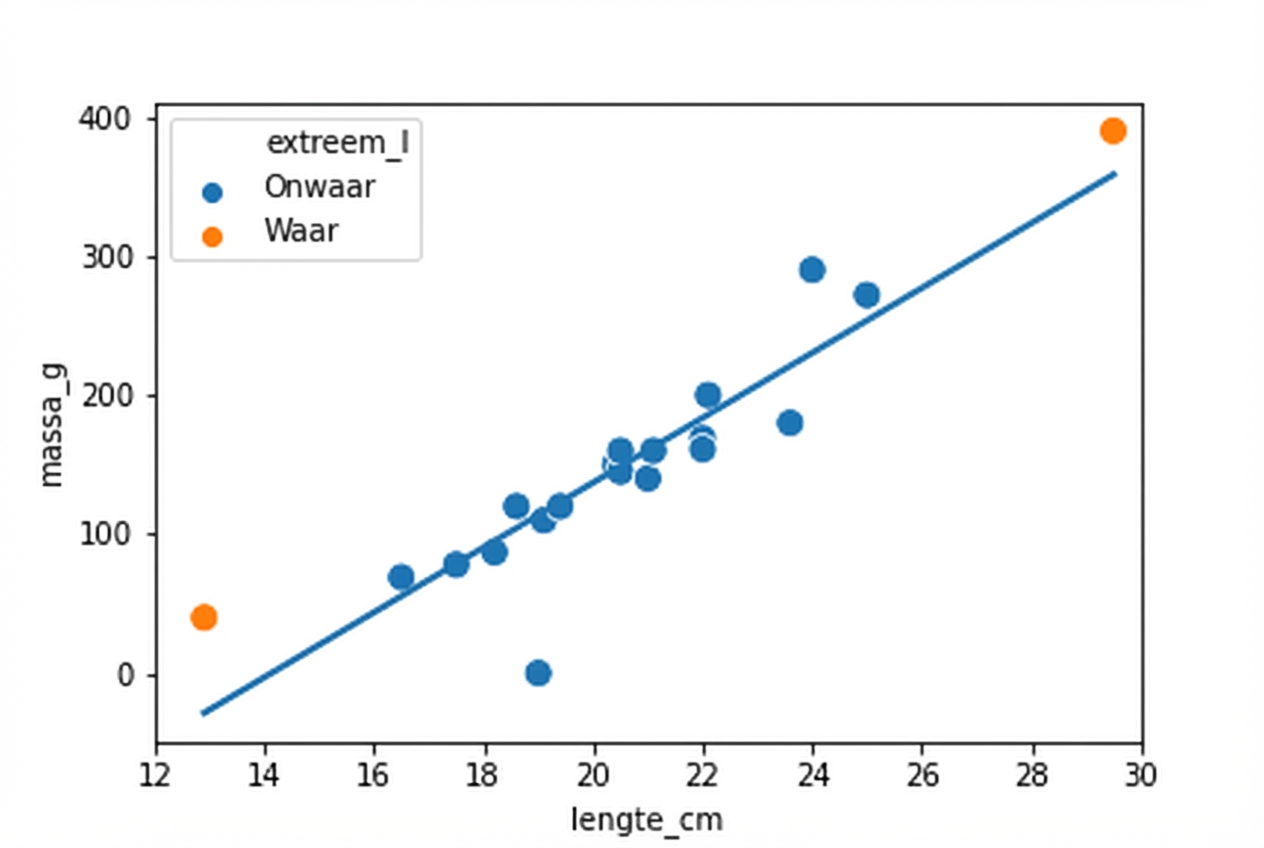
Responswaarden ver van de regressielijn
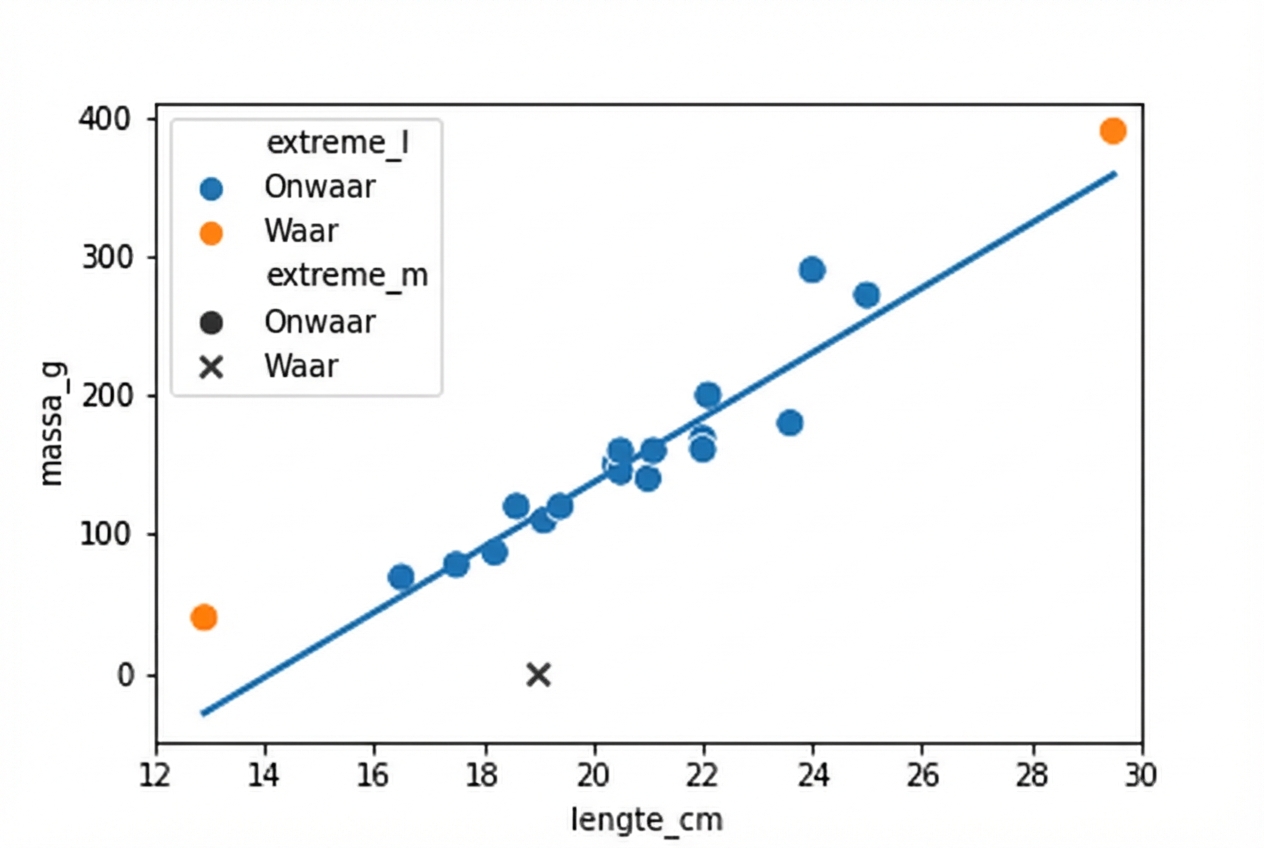
Leverage en invloed
Leverage meet hoe extreem de waarden van de verklarende variabele zijn.
Invloed meet hoeveel het model zou veranderen als je de observatie weglaat bij het modelleren.

De meest invloedrijke voorn verwijderen