De passing van logistische regressie kwantificeren

Introductie tot regressie met statsmodels in Python

Maarten Van den Broeck

Content Developer at DataCamp

De vier uitkomsten

voorspeld onwaar voorspeld waar
werkelijk onwaar correct fout-positief
werkelijk waar fout-negatief correct
Introductie tot regressie met statsmodels in Python

Confusion matrix: aantallen uitkomsten

actual_response = churn["has_churned"]
predicted_response = np.round(mdl_recency.predict())
outcomes = pd.DataFrame({"actual_response": actual_response,
                         "predicted_response": predicted_response})
print(outcomes.value_counts(sort=False))
actual_response  predicted_response
0                0.0                   141
                 1.0                    59
1                0.0                   111
                 1.0                    89
Introductie tot regressie met statsmodels in Python

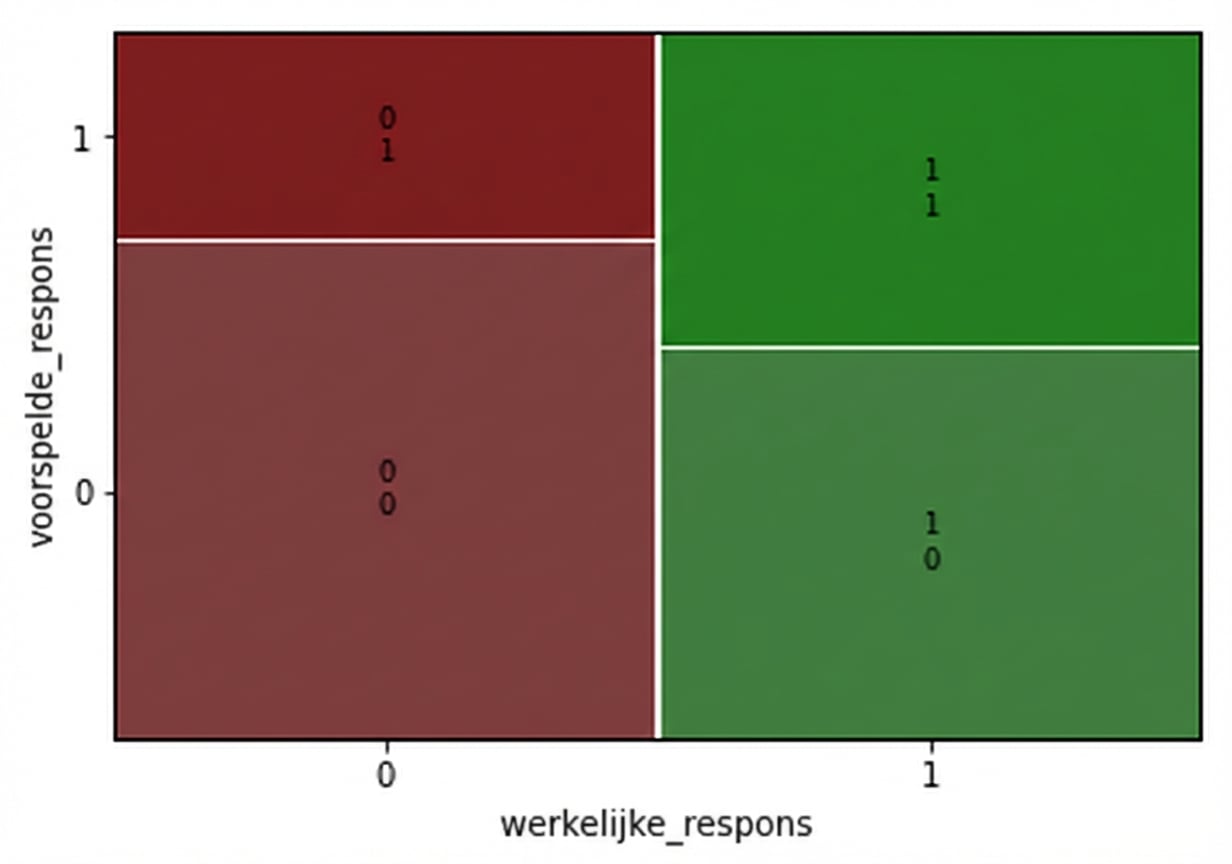
De confusion matrix visualiseren

conf_matrix = mdl_recency.pred_table()

print(conf_matrix)
[[141.              59.]
 [111.              89.]] 
true negative false positive
false negative true positive
from statsmodels.graphics.mosaicplot
import mosaic

mosaic(conf_matrix)

Een mozaïekplot van de uitkomsten van het churn-versus-recency-model. Er zijn 200 observaties voor zowel echte churns als echte niet-churns, dus elke kolom heeft dezelfde breedte.

Introductie tot regressie met statsmodels in Python

Nauwkeurigheid

Nauwkeurigheid is het aandeel correcte voorspellingen.

$$ \text{accuracy} = \frac{TN + TP}{TN + FN + FP + TP} $$

 [[141.,  59.],
  [111.,  89.]]
TN = conf_matrix[0,0]
TP = conf_matrix[1,1]
FN = conf_matrix[1,0]
FP = conf_matrix[0,1]
acc = (TN + TP) / (TN + TP + FN + FP)
print(acc)
0.575
Introductie tot regressie met statsmodels in Python

Sensitiviteit

Sensitiviteit is het aandeel echte positieven.

$$ \text{sensitivity} = \frac{TP}{FN + TP} $$

 [[141.,  59.],
  [111.,  89.]]
TN = conf_matrix[0,0]
TP = conf_matrix[1,1]
FN = conf_matrix[1,0]
FP = conf_matrix[0,1]
sens = TP / (FN + TP)
print(sens)
0.445
Introductie tot regressie met statsmodels in Python

Specificiteit

Specificiteit is het aandeel echte negatieven.

$$ \text{specificity} = \frac{TN}{TN + FP} $$

 [[141.,  59.],
  [111.,  89.]]
TN = conf_matrix[0,0]
TP = conf_matrix[1,1]
FN = conf_matrix[1,0]
FP = conf_matrix[0,1]
spec = TN / (TN + FP)
print(spec)
0.705
Introductie tot regressie met statsmodels in Python

Laten we oefenen!

Introductie tot regressie met statsmodels in Python

Preparing Video For Download...