Hypothesetoetsen en z-scores
Hypothesetoetsen in Python

James Chapman
Curriculum Manager, DataCamp
A/B-testen

1 Beeldcredits: "Electronic Arts" door majaX1 CC BY-NC-SA 2.0
A/B-test op retailwebpagina
Controle:

Behandeling:

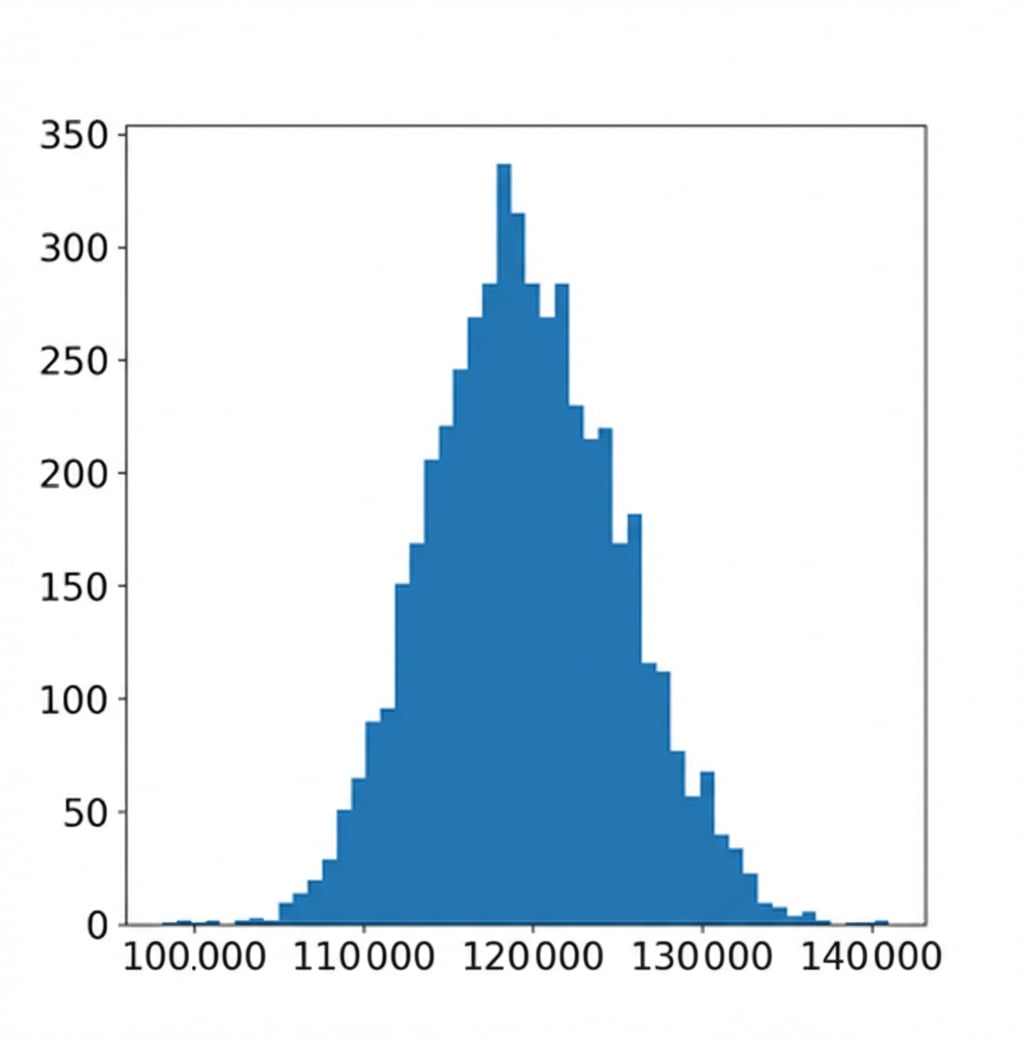
De bootstrapverdeling visualiseren
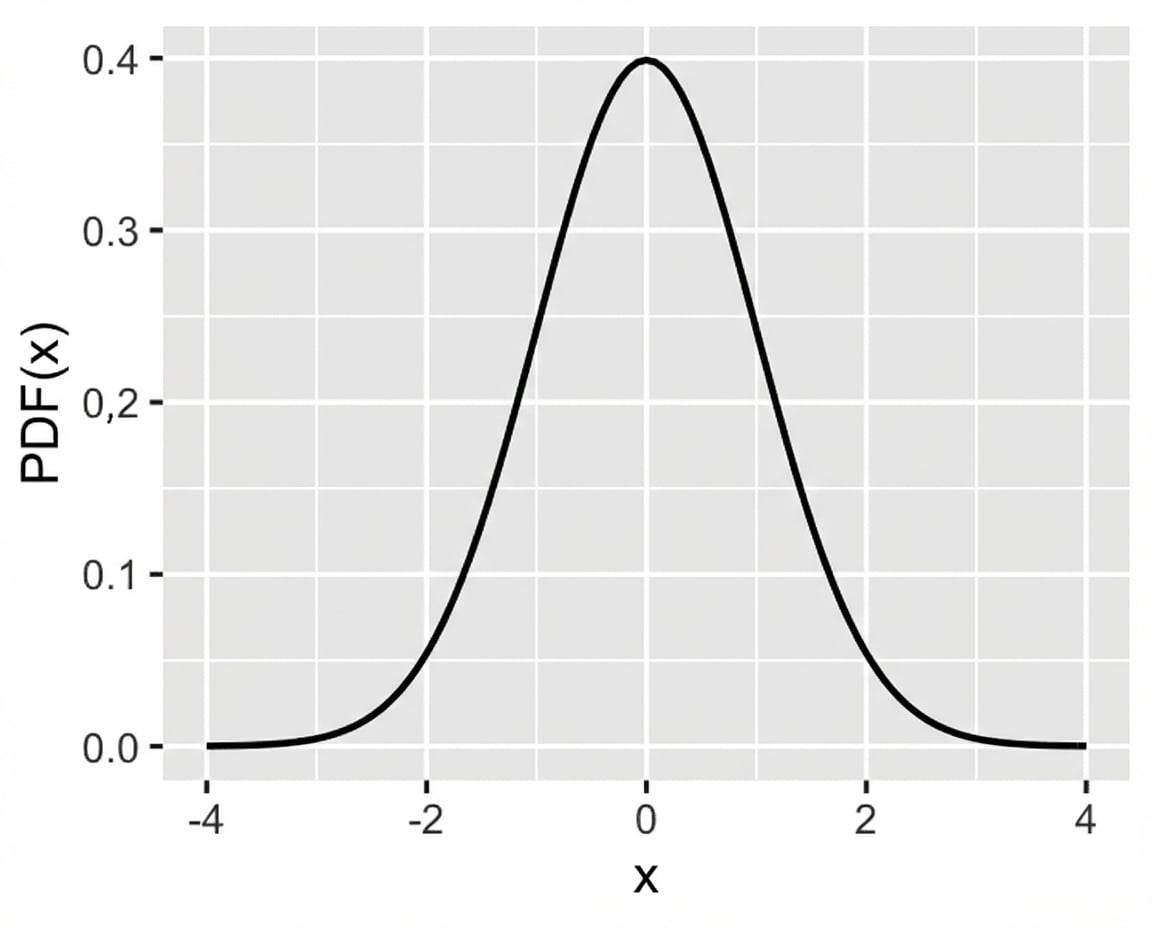
Standaardnormale (z) verdeling
Standaardnormale verdeling: normale verdeling met gemiddelde = 0 en standaardafwijking = 1