De coördinatenlaag
Gevorderde datavisualisatie met ggplot2

Rick Scavetta
Founder, Scavetta Academy
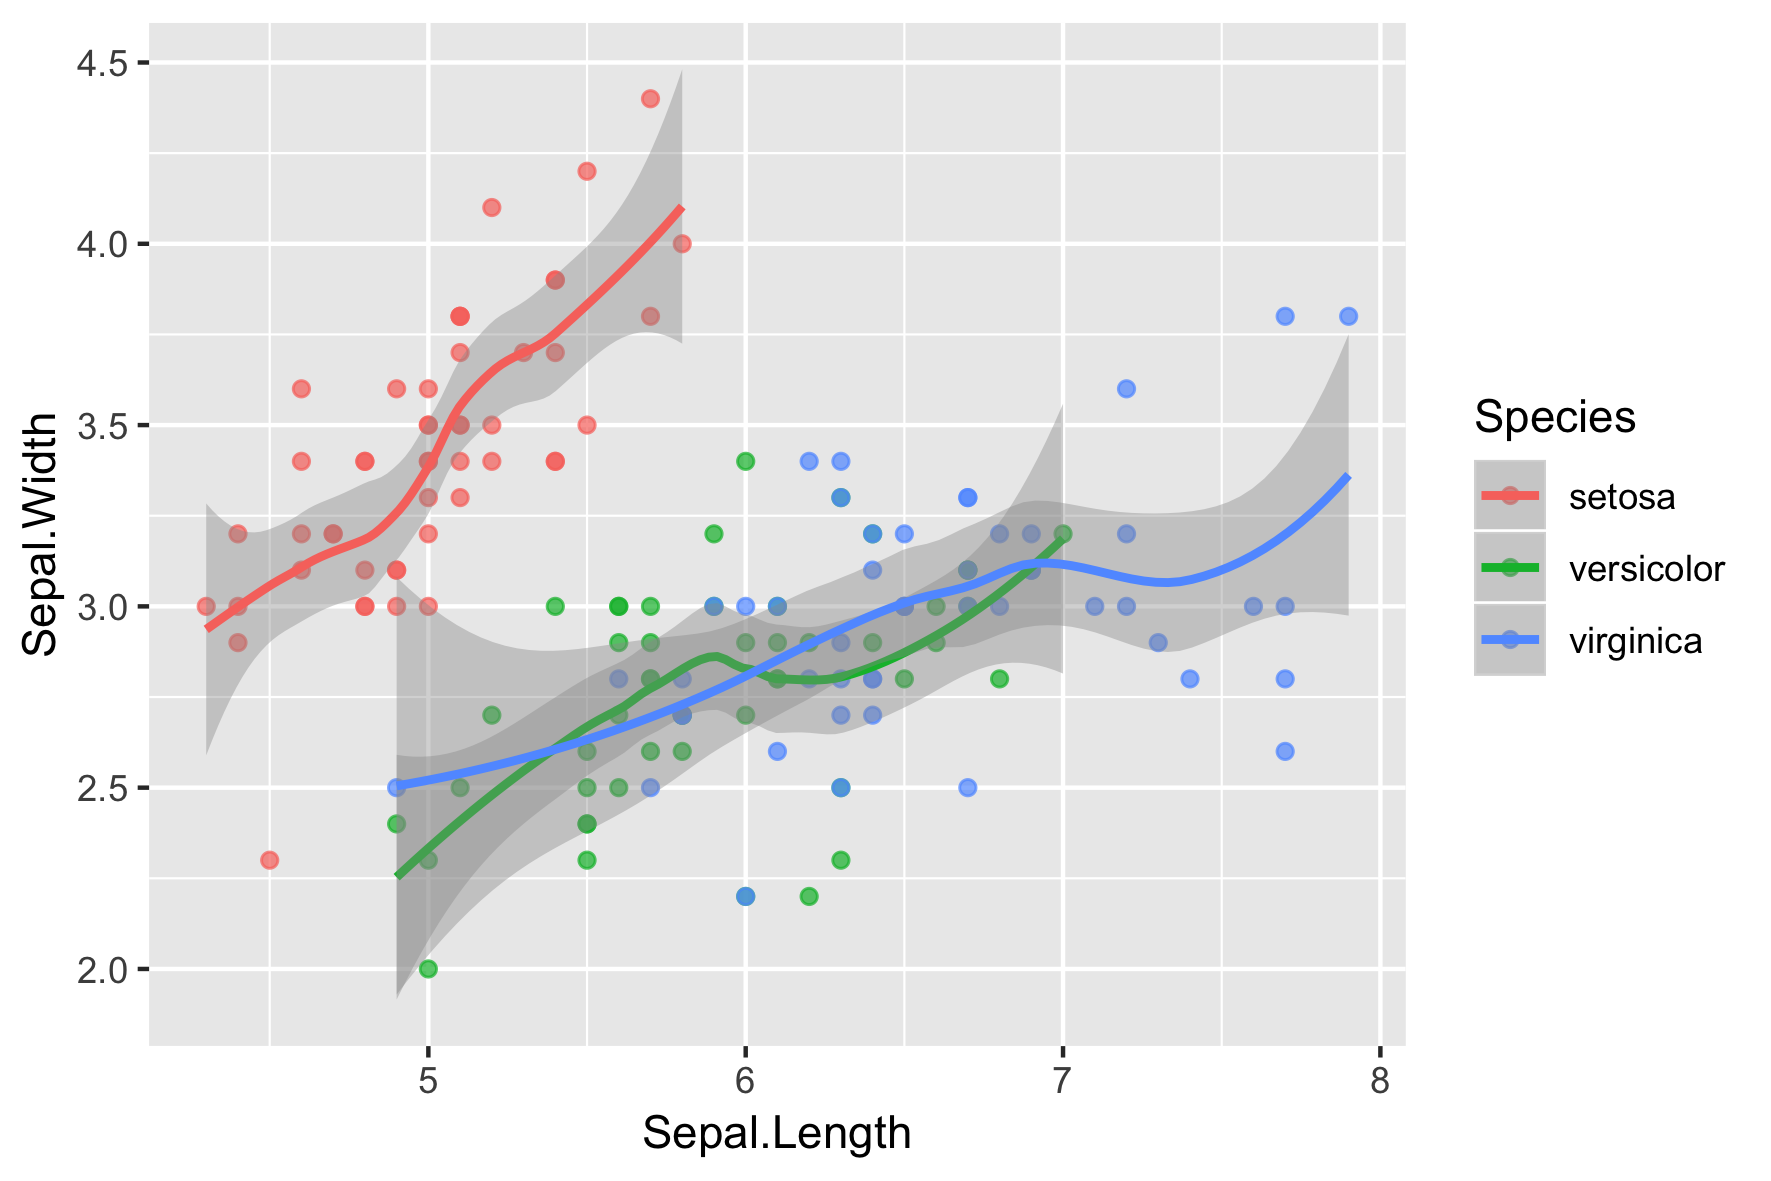
Originele plot
scale_x_continuous()

scale_x_continuous()
Originele plot
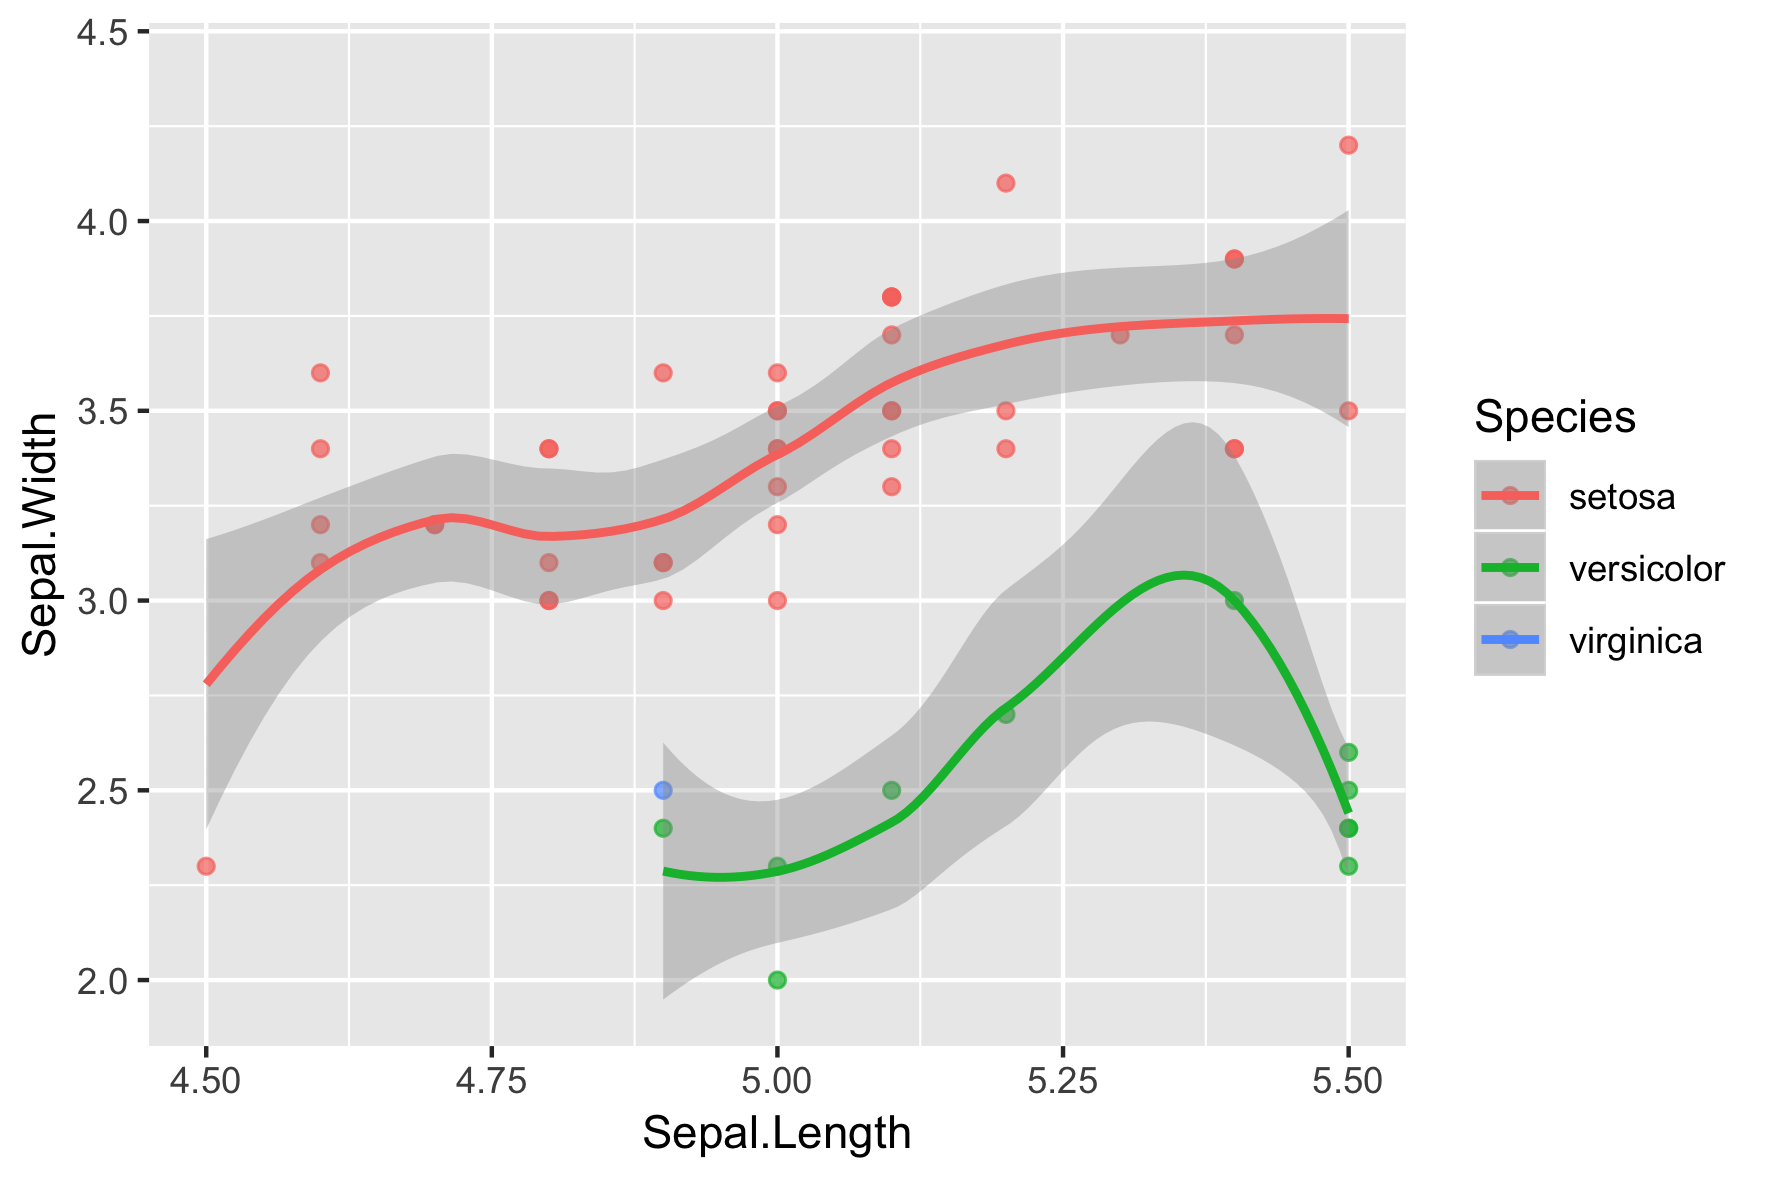
Inzoomen met scale_x_continuous()
Deel van de originele data wordt weggefilterd!
xlim()
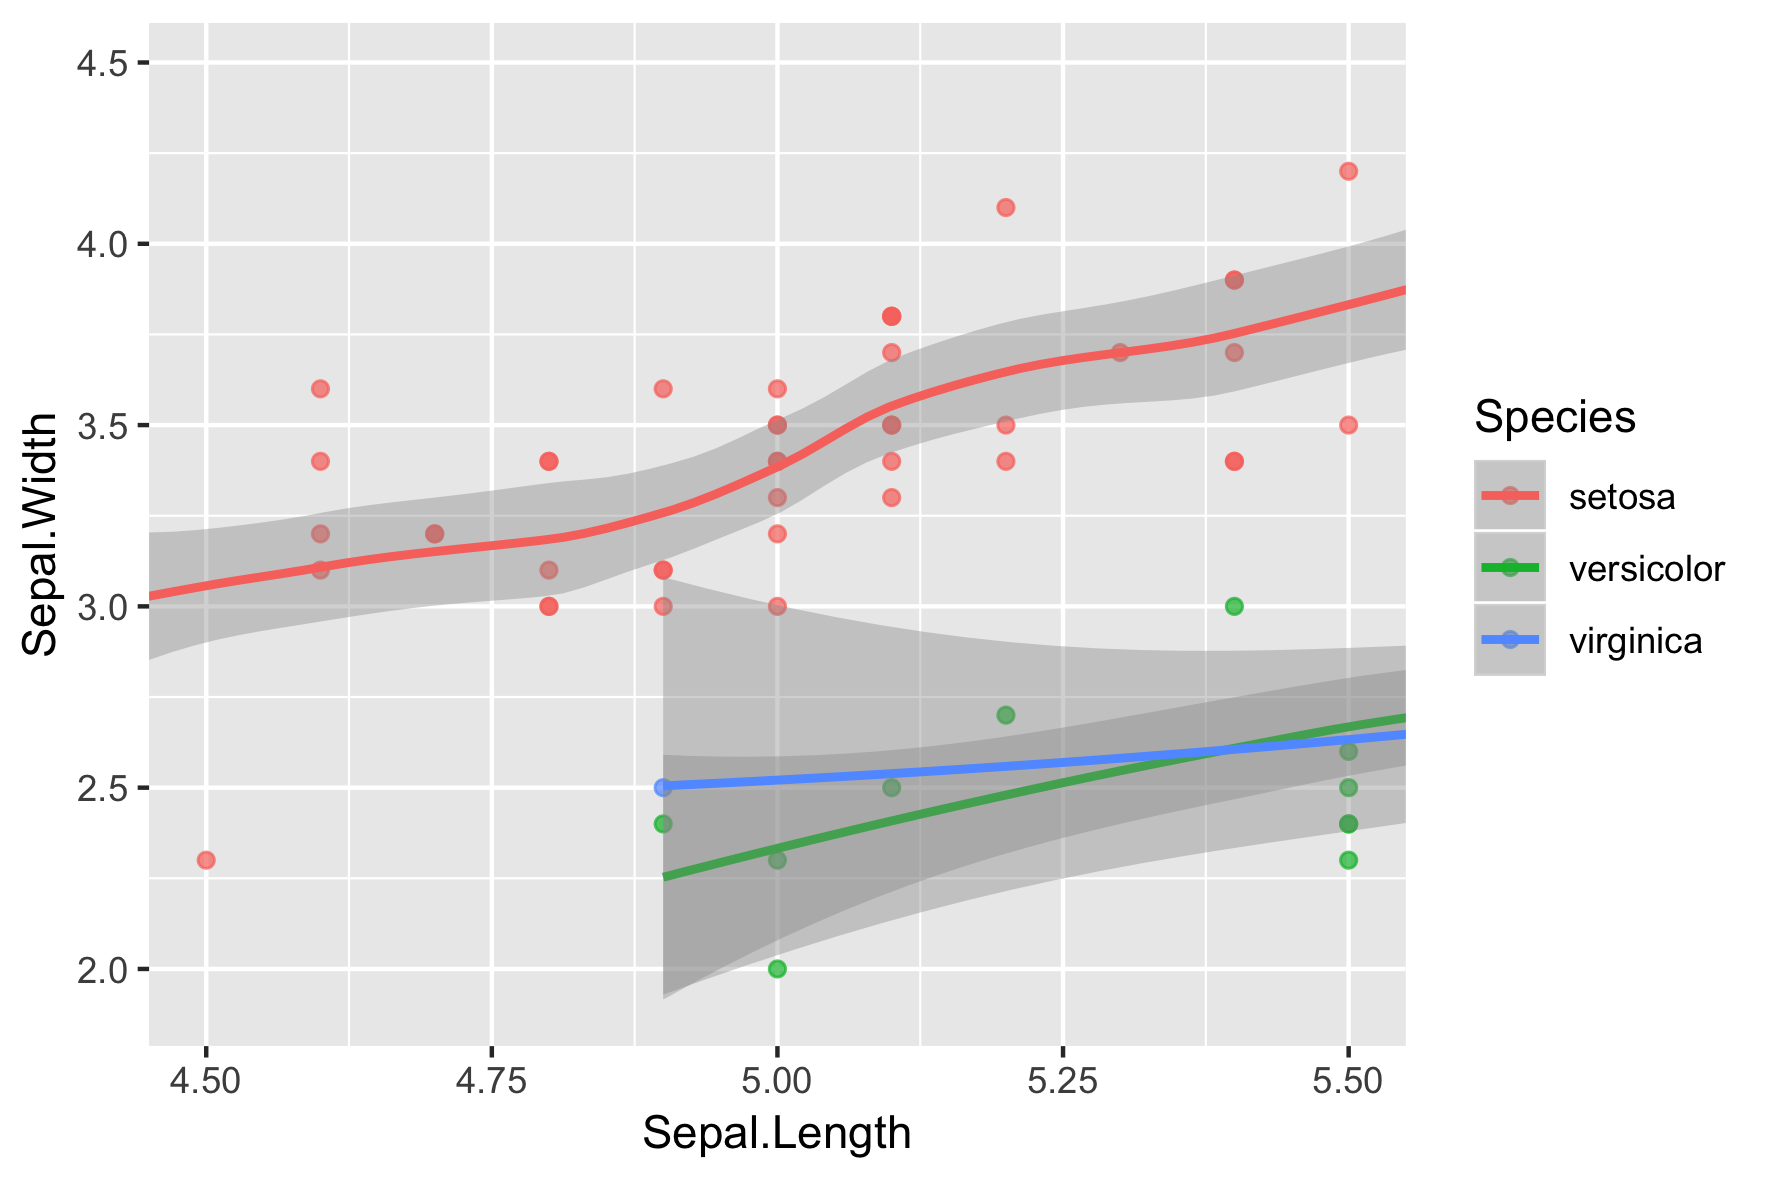
coord_cartesian()
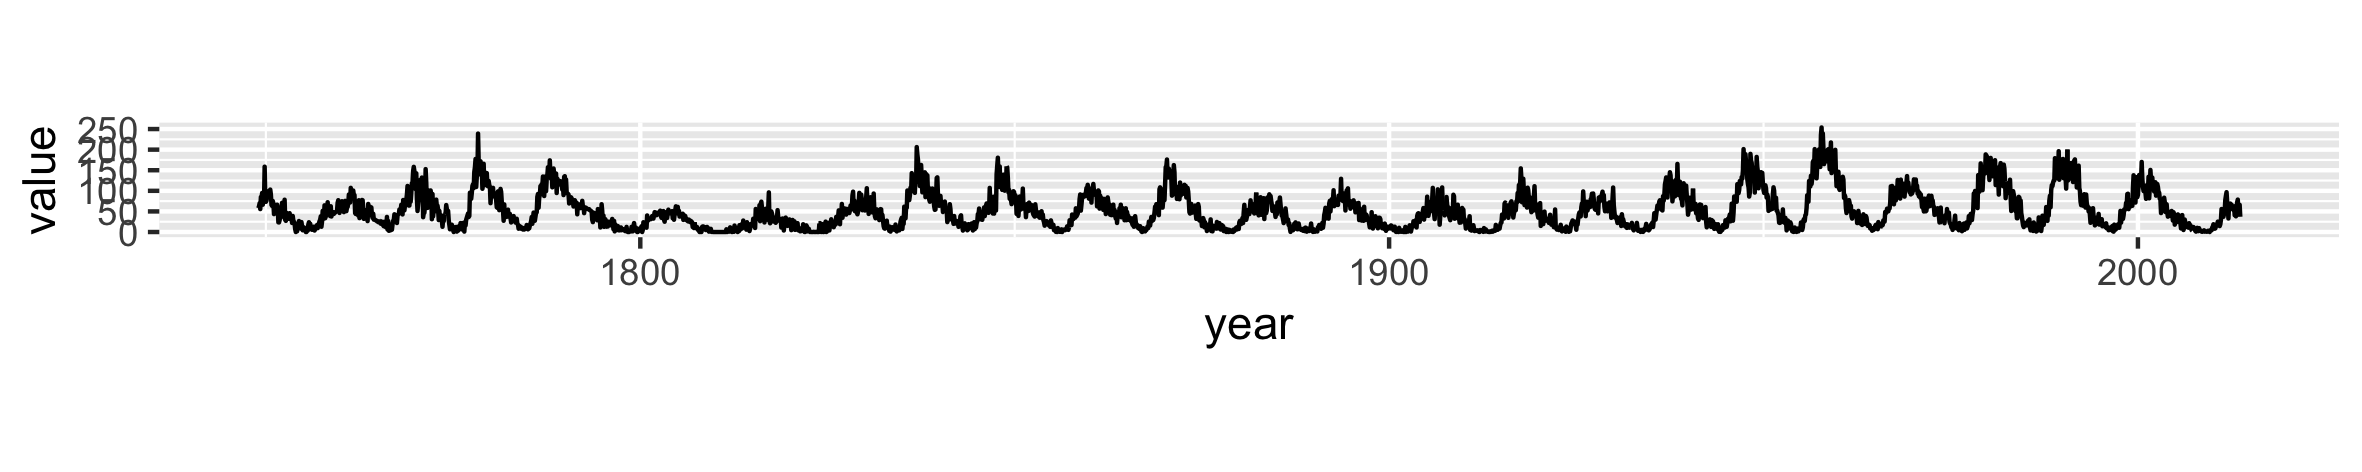
Zonnevlekken
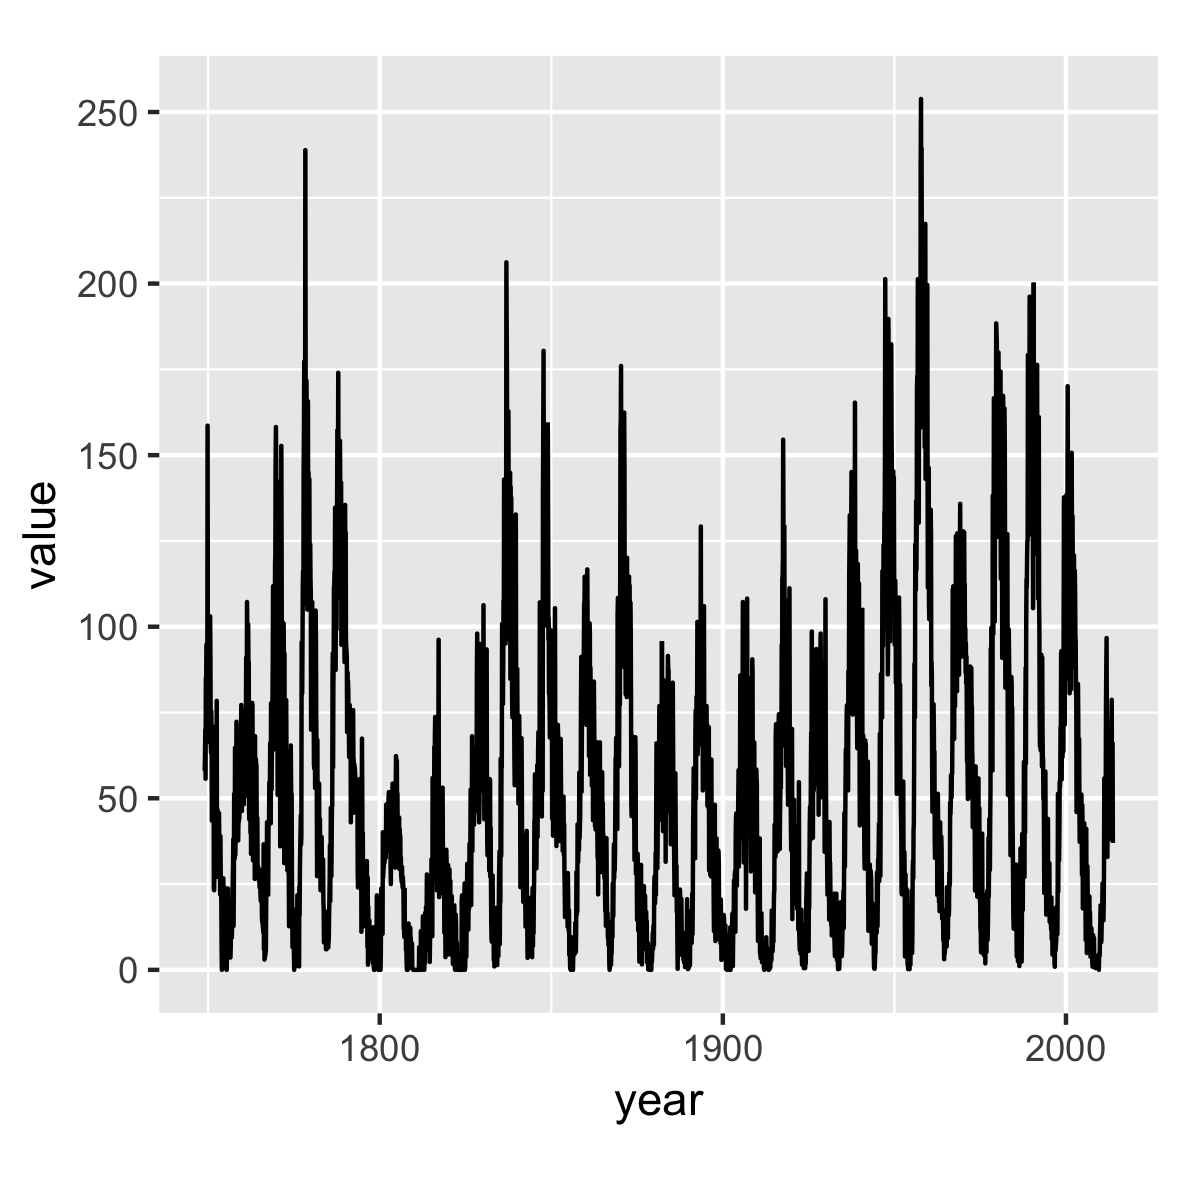
Zonnevlekken