Tijdreeksgegevens manipuleren in Python
Stefan Jansen
Founder & Lead Data Scientist at Applied Artificial Intelligence
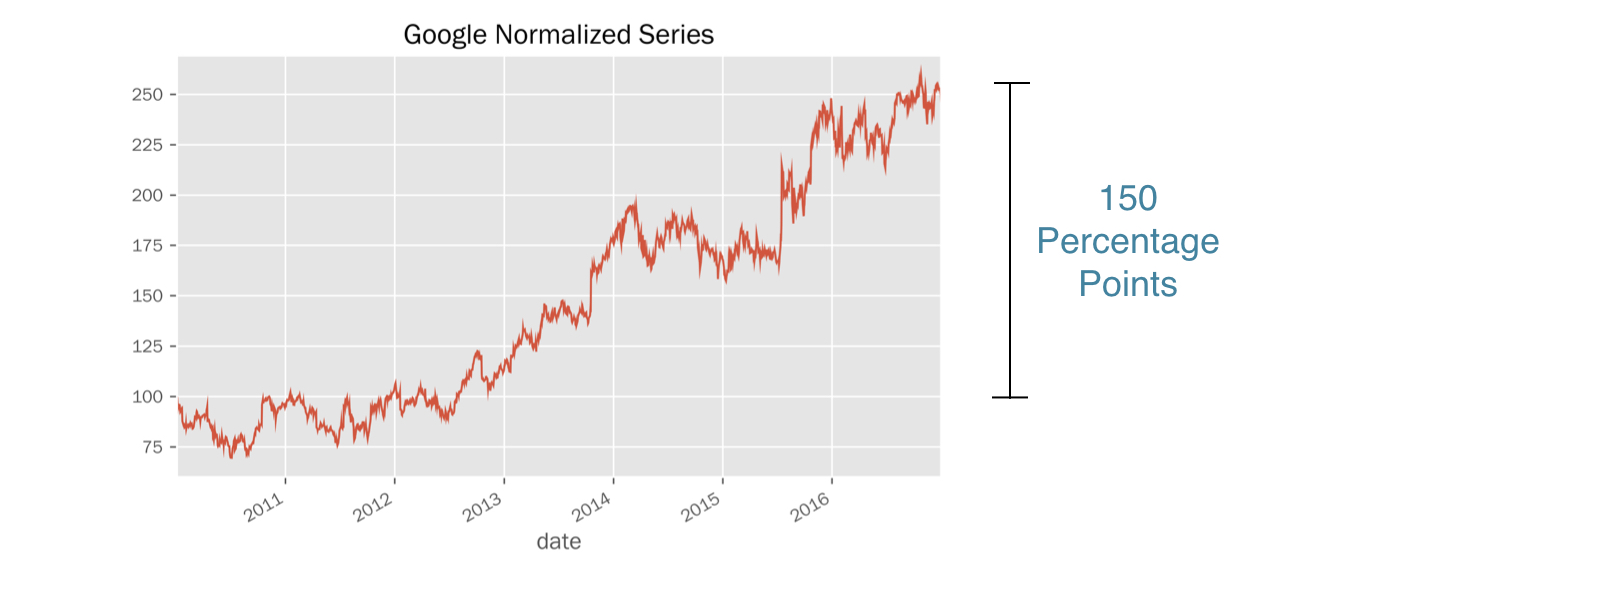
Koersreeksen: lastig te vergelijken bij verschillende niveaus
Eenvoudige oplossing: normaliseer reeksen tot start op 100
Deel alle koersen door de eerste, maal 100
Zelfde startpunt
Alle koersen relatief tot startpunt
Verschil t.o.v. startpunt in procentpunten
google = pd.read_csv('google.csv', parse_dates=['date'], index_col='date')google.head(3)
price
date
2010-01-04 313.06
2010-01-05 311.68
2010-01-06 303.83
first_price = google.price.iloc[0] # int-based selectionfirst_price
313.06
first_price == google.loc('2010-01-04', 'price')
True
normalized = google.price.div(first_price).mul(100)normalized.plot(title='Google Normalized Series')
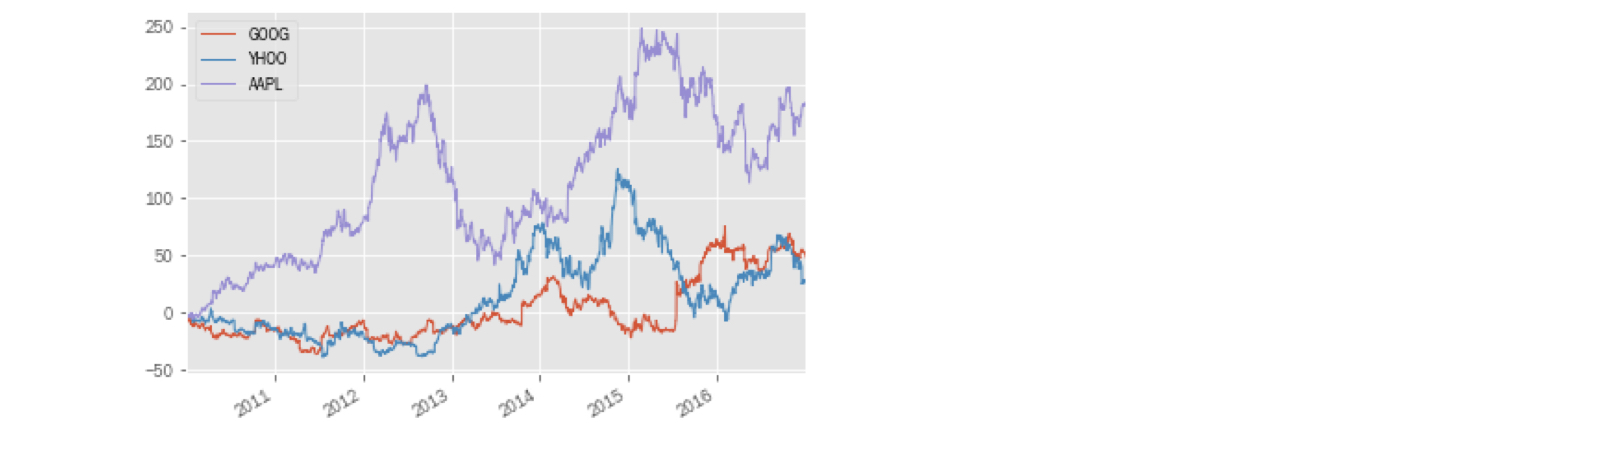
prices = pd.read_csv('stock_prices.csv', parse_dates=['date'], index_col='date')prices.info()
DatetimeIndex: 1761 entries, 2010-01-04 to 2016-12-30
Data columns (total 3 columns):
AAPL 1761 non-null float64
GOOG 1761 non-null float64
YHOO 1761 non-null float64
dtypes: float64(3)
prices.head(2)
AAPL GOOG YHOO
Date
2010-01-04 30.57 313.06 17.10
2010-01-05 30.63 311.68 17.23
prices.iloc[0]
AAPL 30.57
GOOG 313.06
YHOO 17.10
Name: 2010-01-04 00:00:00, dtype: float64
normalized = prices.div(prices.iloc[0])normalized.head(3)
AAPL GOOG YHOO
Date
2010-01-04 1.000000 1.000000 1.000000
2010-01-05 1.001963 0.995592 1.007602
2010-01-06 0.985934 0.970517 1.004094
.div(): automatische uitlijning van Series-index en DataFrame-kolommenindex = pd.read_csv('benchmark.csv', parse_dates=['date'], index_col='date')index.info()
DatetimeIndex: 1826 entries, 2010-01-01 to 2016-12-30
Data columns (total 1 columns):
SP500 1762 non-null float64
dtypes: float64(1)
prices = pd.concat([prices, index], axis=1).dropna()prices.info()
DatetimeIndex: 1761 entries, 2010-01-04 to 2016-12-30
Data columns (total 4 columns):
AAPL 1761 non-null float64
GOOG 1761 non-null float64
YHOO 1761 non-null float64
SP500 1761 non-null float64
dtypes: float64(4)
prices.head(1)
AAPL GOOG YHOO SP500
2010-01-04 30.57 313.06 17.10 1132.99
normalized = prices.div(prices.iloc[0]).mul(100)normalized.plot()
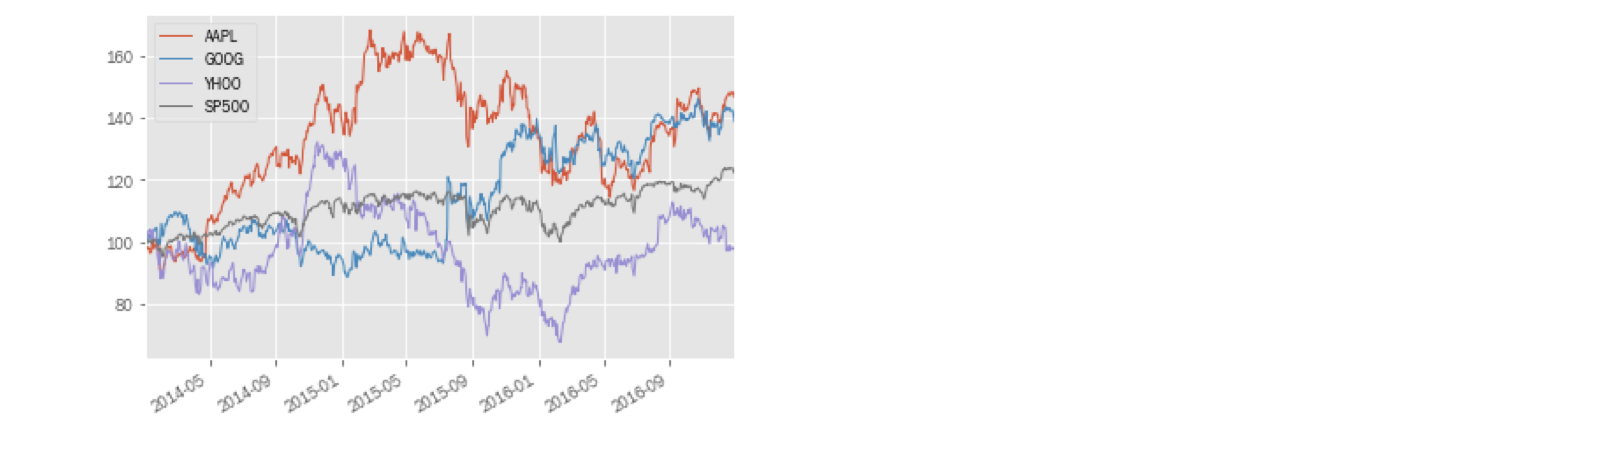
diff = normalized[tickers].sub(normalized['SP500'], axis=0)
GOOG YHOO AAPL
2010-01-04 0.000000 0.000000 0.000000
2010-01-05 -0.752375 0.448669 -0.115294
2010-01-06 -3.314604 0.043069 -1.772895
.sub(..., axis=0): trek een Series af van elke DataFrame-kolom door indexen uit te lijnendiff.plot()

Tijdreeksgegevens manipuleren in Python