Chi-kwadraattoets op onafhankelijkheid
Hypothesis Testing in R

Richie Cotton
Data Evangelist at DataCamp
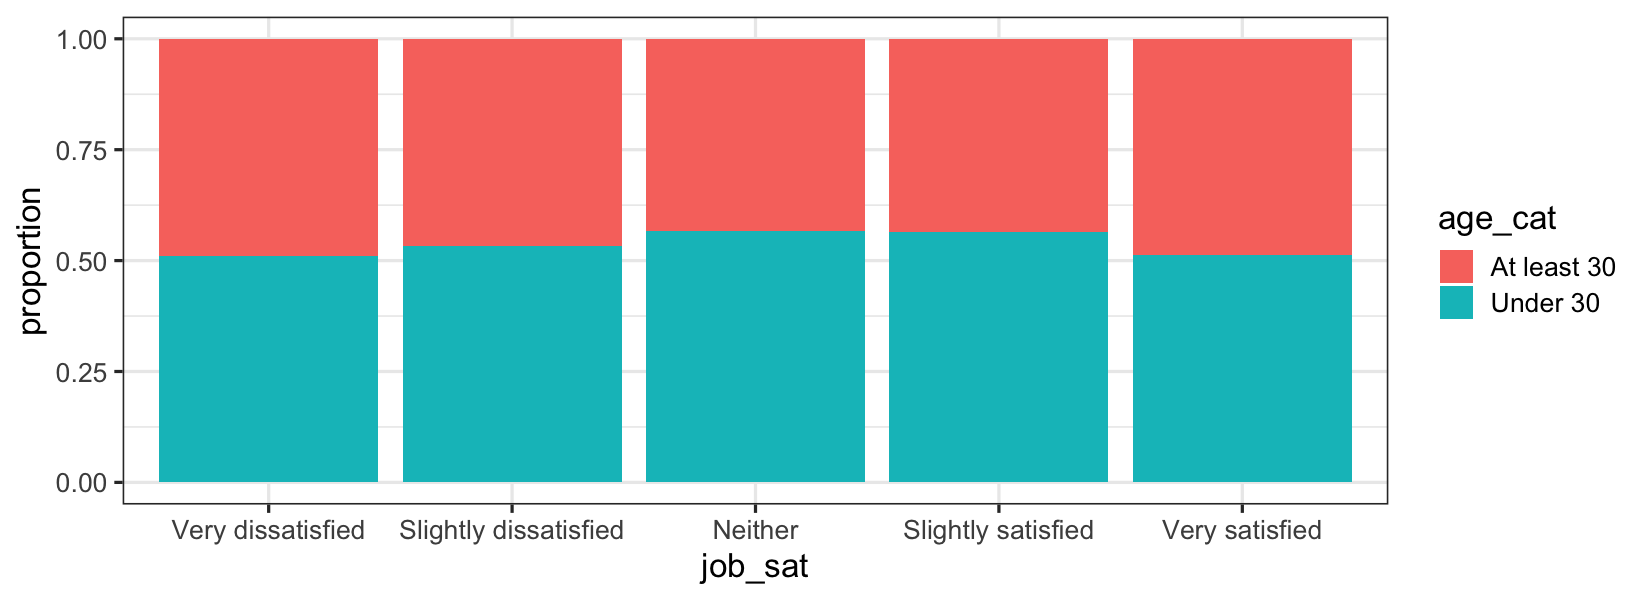
Verkennende visualisatie: proportioneel gestapelde staafdiagram
ggplot(stack_overflow, aes(job_sat, fill = age_cat)) +
  geom_bar(position = "fill") +
  ylab("proportion")
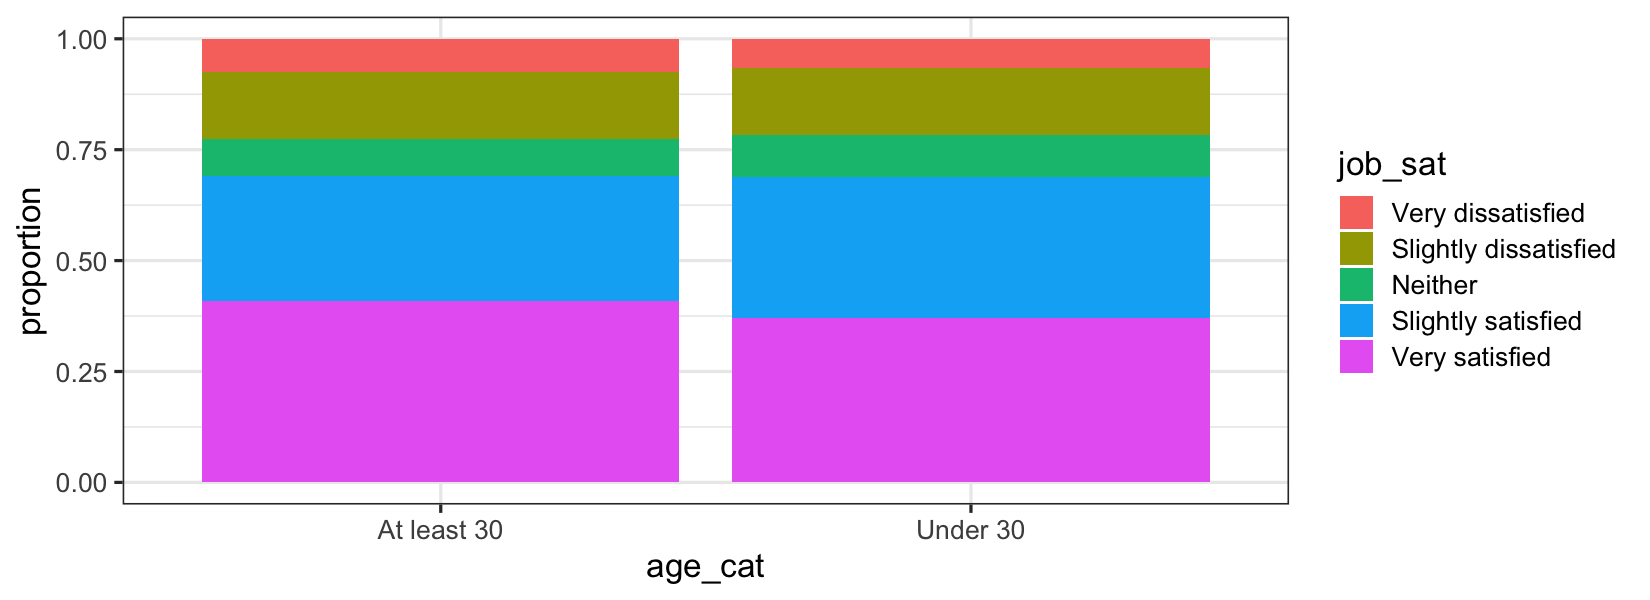
Variabelen omdraaien?
ggplot(stack_overflow, aes(age_cat, fill = job_sat)) +
  geom_bar(position = "fill") +
  ylab("proportion")