Chi-kwadraat goodness-of-fit-toetsen

Hypothesis Testing in R

Richie Cotton

Data Evangelist at DataCamp

Paarse links

Je zoekt online een code-oplossing en de eerste link is paars omdat je die al bezocht hebt. Hoe voel je je?

purple_link_counts <- stack_overflow %>% 
  count(purple_link)
# A tibble: 4 x 2
  purple_link           n
  <fct>             <int>
1 Hello, old friend  1330
2 Amused              409
3 Indifferent         426
4 Annoyed             290
Hypothesis Testing in R

Hypothesen formuleren

hypothesized <- tribble(
  ~ purple_link, ~ prop,
  "Hello, old friend", 1 / 2,
  "Amused"           , 1 / 6,
  "Indifferent"      , 1 / 6,
  "Annoyed"          , 1 / 6
)
# A tibble: 4 x 2
  purple_link        prop
  <chr>             <dbl>
1 Hello, old friend 0.5  
2 Amused            0.167
3 Indifferent       0.167
4 Annoyed           0.167

H0: De steekproef volgt de veronderstelde verdeling.

HA: De steekproef wijkt af van de veronderstelde verdeling.

De teststatistiek, χ², meet hoe ver de waarnemingen per groep van de verwachting afliggen.

alpha <- 0.01
1 tribble staat voor "row-wise tibble"; niet te verwarren met de aliens uit Star Trek
Hypothesis Testing in R

Verwachte aantallen per categorie

n_total <- nrow(stack_overflow)
hypothesized <- tribble(
  ~ purple_link, ~ prop,
  "Hello, old friend", 1 / 2,
  "Amused"           , 1 / 6,
  "Indifferent"      , 1 / 6,
  "Annoyed"          , 1 / 6
) %>%
  mutate(n = prop * n_total)
# A tibble: 4 x 3
  purple_link        prop     n
  <chr>             <dbl> <dbl>
1 Hello, old friend 0.5   1228.
2 Amused            0.167  409.
3 Indifferent       0.167  409.
4 Annoyed           0.167  409.
Hypothesis Testing in R

Aantallen visualiseren

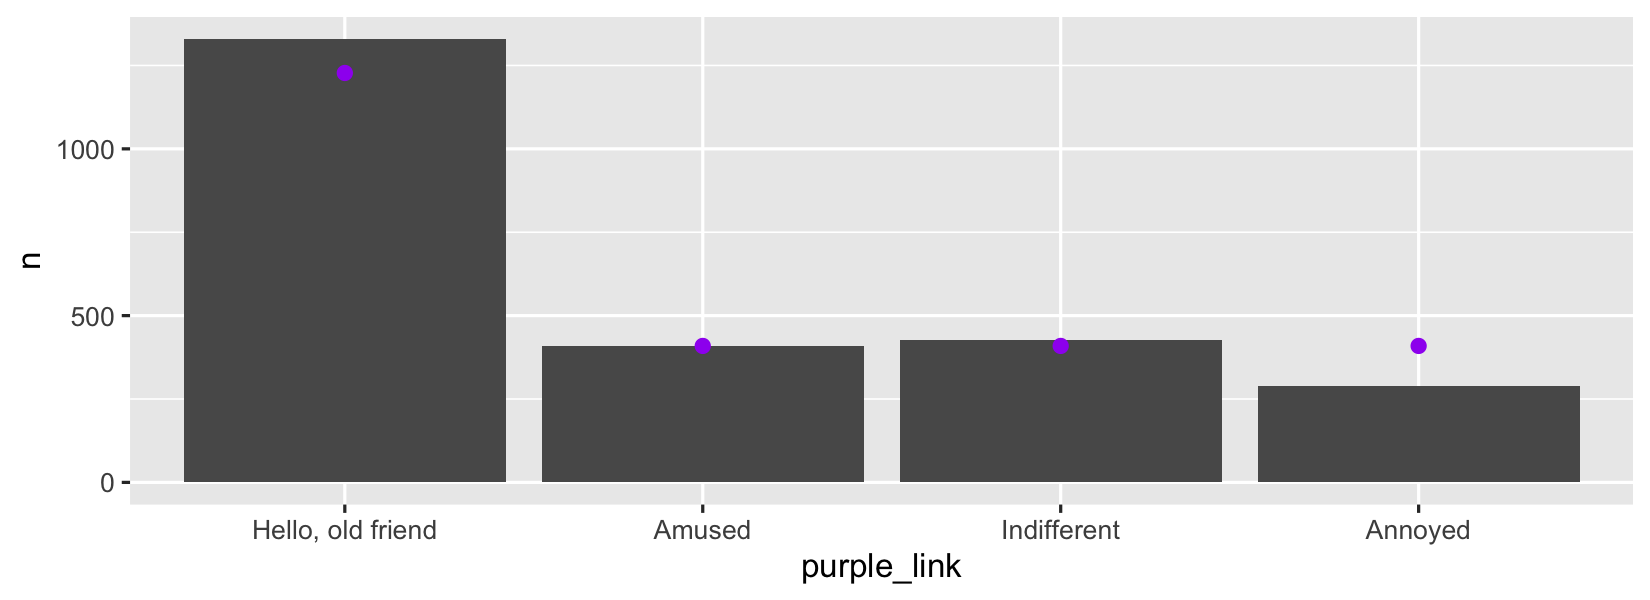
ggplot(purple_link_counts, aes(purple_link, n)) +
  geom_col() +
  geom_point(data = hypothesized, color = "purple")

Staafdiagram van aantal antwoorden vs purple_link-antwoorden met paarse punten voor de veronderstelde aantallen

Hypothesis Testing in R

Chi-kwadraat goodness-of-fit met chisq_test()

hypothesized_props <- c(
  "Hello, old friend" = 1 / 2,
  Amused              = 1 / 6,
  Indifferent         = 1 / 6,
  Annoyed             = 1 / 6
)
library(infer)
stack_overflow %>% 
  chisq_test(
    response = purple_link,
    p = hypothesized_props
  )
# A tibble: 1 x 3
  statistic chisq_df       p_value
      <dbl>    <dbl>         <dbl>
1      44.0        3 0.00000000154
Hypothesis Testing in R

Laten we oefenen!

Hypothesis Testing in R

Preparing Video For Download...