Het 'Er is maar één test'-framework
Hypothesis Testing in R

Richie Cotton
Data Evangelist at DataCamp
Onevenwichtige data
stack_overflow_imbalanced %>%
  count(hobbyist, age_cat, .drop = FALSE)
  hobbyist     age_cat    n
1       No At least 30    0
2       No    Under 30  191
3      Yes At least 30   15
4      Yes    Under 30 1025
Een steekproef is onevenwichtig als sommige groepen veel groter zijn dan andere.
Hypothesen
$H_{0}$: Het aandeel hobbyisten onder 30 is hetzelfde als het aandeel hobbyisten van minstens 30.
$H_{A}$: Het aandeel hobbyisten onder 30 is anders dan het aandeel hobbyisten van minstens 30.
alpha <- 0.1
Toch doorgaan met een proportietoets
stack_overflow_imbalanced %>%
  prop_test(
    hobbyist ~ age_cat,
    order = c("At least 30", "Under 30"),
    success = "Yes",
    alternative = "two.sided",
    correct = FALSE
  )
# A tibble: 1 x 6
  statistic chisq_df p_value alternative lower_ci upper_ci
      <dbl>    <dbl>   <dbl> <chr>          <dbl>    <dbl>
1      2.79        1  0.0949 two.sided    0.00718   0.0217
Een grammatica van graphics
| Grafiektype | base-R | ggplot2 |
|---|---|---|
| Scatterplot | plot(, type = "p") |
ggplot() + geom_point() |
| Lijnplot | plot(, type = "l") |
ggplot() + geom_line() |
| Histogram | hist() |
ggplot() + geom_histogram() |
| Boxplot | boxplot() |
ggplot() + geom_boxplot() |
| Staafdiagram | barplot() |
ggplot() + geom_bar() |
| Cirkeldiagram | pie() |
ggplot() + geom_bar() + coord_polar() |
Een grammatica van hypothesetoetsen
- Allen Downey's framework There is only one test.
- Geïmplementeerd in R in het
infer-pakket. generate()maakt gesimuleerde data.- Rekenintensief.
- Robuust bij kleine steekproeven of onevenwichtige data.
null_distn <- dataset %>%
  specify() %>%
  hypothesize() %>%
  generate() %>%
  calculate()
obs_stat <- dataset %>%
  specify() %>%
  calculate()
get_p_value(null_distn, obs_stat)
1 Allen Downey geeft les in "Exploratory Data Analysis in Python".
Variabelen van interesse specificeren
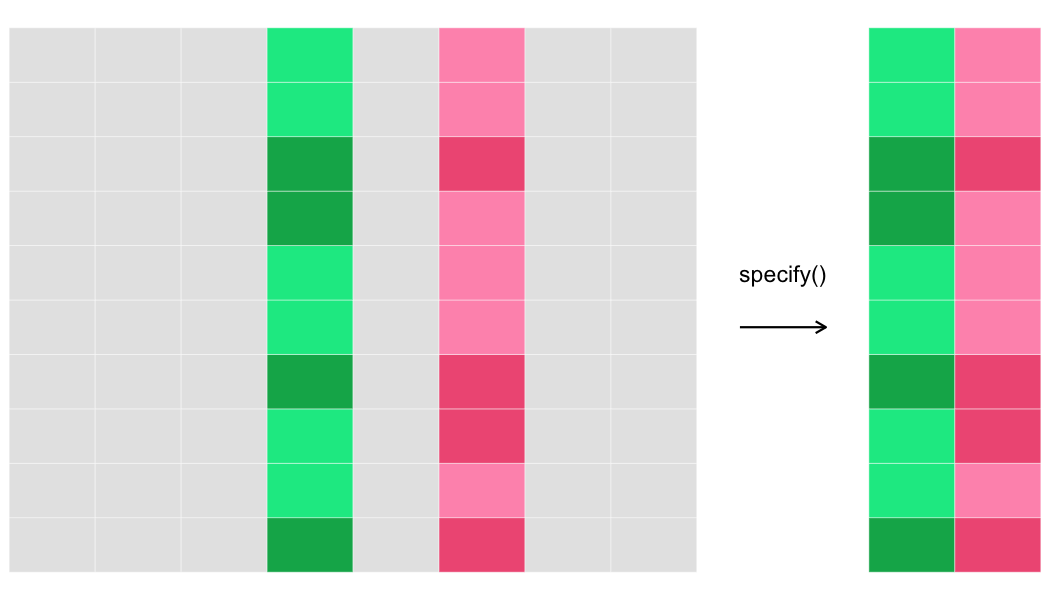
specify()
specify()kiest de variabele(n) die je wilt testen.
- Voor 2-sample tests:
response ~ explanatory. - Voor 1-sample tests:
response ~ NULL.
stack_overflow_imbalanced %>%
  specify(hobbyist ~ age_cat, success = "Yes")
Response: hobbyist (factor)
Explanatory: age_cat (factor)
# A tibble: 1,231 x 2
  hobbyist age_cat
  <fct>    <fct>
1 Yes      At least 30
2 Yes      At least 30
3 Yes      At least 30
4 Yes      Under 30
5 Yes      At least 30
6 Yes      At least 30
7 No       Under 30
# ... with 1,224 more rows
hypothesize()
hypothesize()bepaalt het type nulhypothese.
- Voor 2-sample tests:
"independence"of"point". - Voor 1-sample tests:
"point".
stack_overflow_imbalanced %>%
  specify(hobbyist ~ age_cat, success = "Yes") %>%
  hypothesize(null = "independence")
Response: hobbyist (factor)
Explanatory: age_cat (factor)
Null Hypothesis: independence
# A tibble: 1,231 x 2
  hobbyist age_cat
  <fct>    <fct>
1 Yes      At least 30
2 Yes      At least 30
3 Yes      At least 30
4 Yes      Under 30
5 Yes      At least 30
6 Yes      At least 30
7 No       Under 30
# ... with 1,224 more rows
Laten we oefenen!
Hypothesis Testing in R

