Waarden retourneren uit functies
Introductie tot functies schrijven in R

Richie Cotton
Data Evangelist at DataCamp
Veel plots retourneren onzichtbaar iets
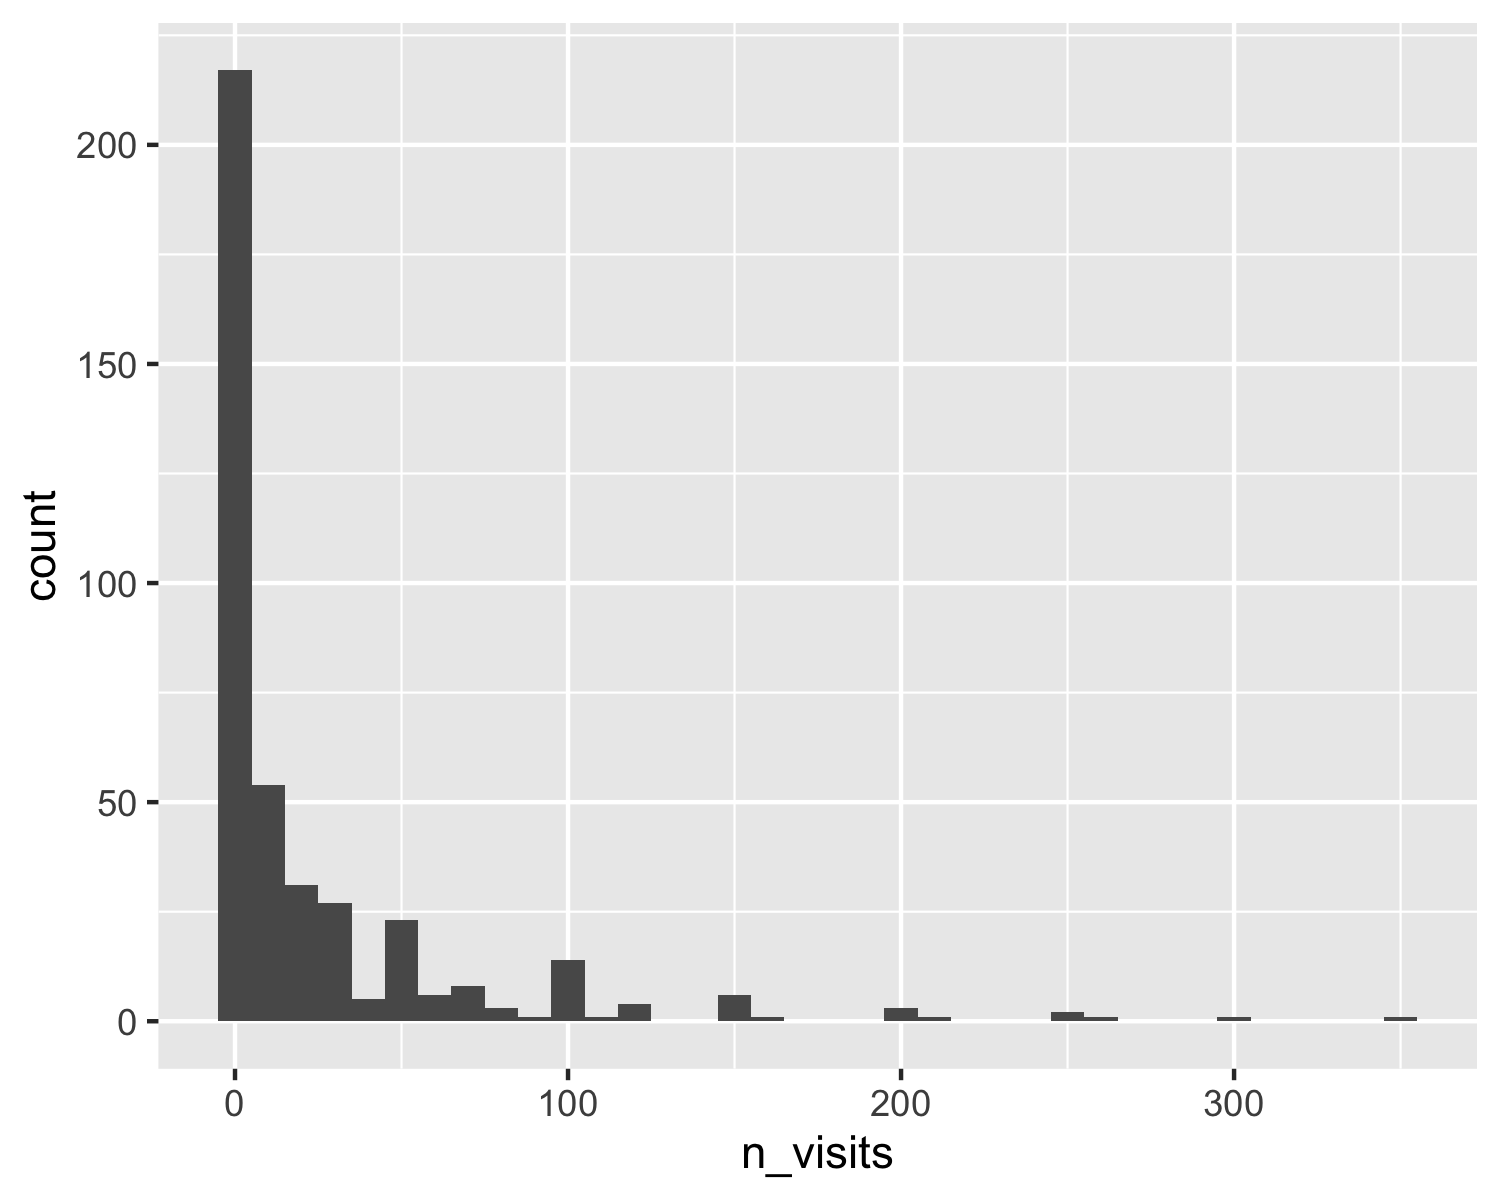
Veel plots retourneren onzichtbaar iets
Introductie tot functies schrijven in R
Richie Cotton
Data Evangelist at DataCamp

