Introductie tot bootstrapping
Steekproeven in R

Richie Cotton
Data Evangelist at DataCamp
Met of zonder
Steekproeven zonder terugleggen

Steekproeven met terugleggen ("resampling")

Eenvoudige aselecte steekproef zonder terugleggen
Populatie

Steekproef

Eenvoudige aselecte steekproef met terugleggen
Populatie
Steekproef

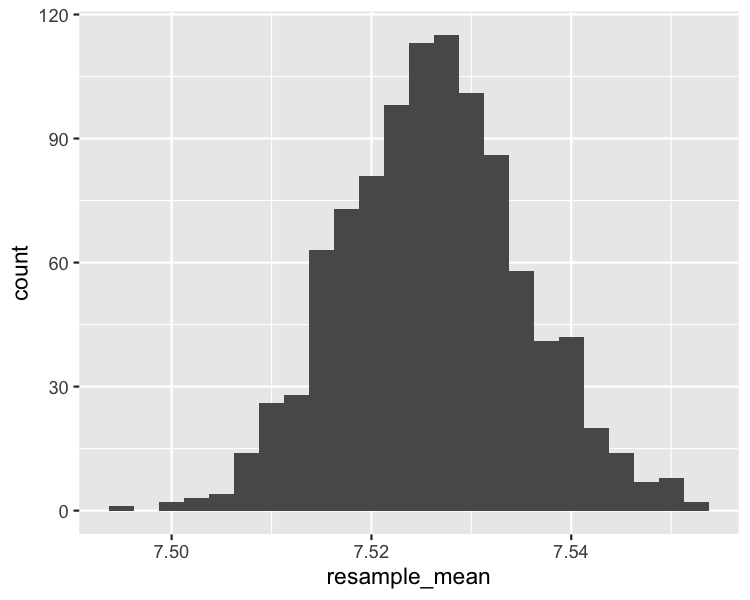
Bootstrapping

Histogram van bootstrap-verdeling