Clusteranalyse in Python
Shaumik Daityari
Business Analyst
# Clustercentra
print(fifa.groupby('cluster_labels')[['scaled_heading_accuracy',
    'scaled_volleys', 'scaled_finishing']].mean())
# Clusteromvang
print(fifa.groupby('cluster_labels')['ID'].count())
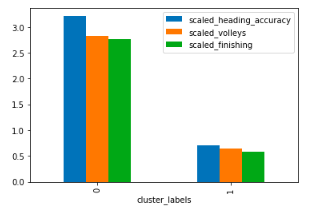
# Plot clustercentra
fifa.groupby('cluster_labels') \
  [scaled_features].mean()
  .plot(kind='bar')
plt.show()
# Namen van top 5 spelers per cluster
for cluster in fifa['cluster_labels'].unique():
    print(cluster, fifa[fifa['cluster_labels'] == cluster]['name'].values[:5])