from scipy.cluster.vq import kmeans, vq
from matplotlib import pyplot as plt
import seaborn as sns, pandas as pd
import random
random.seed((1000,2000))
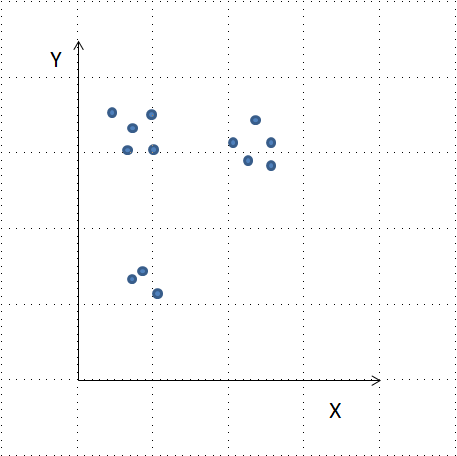
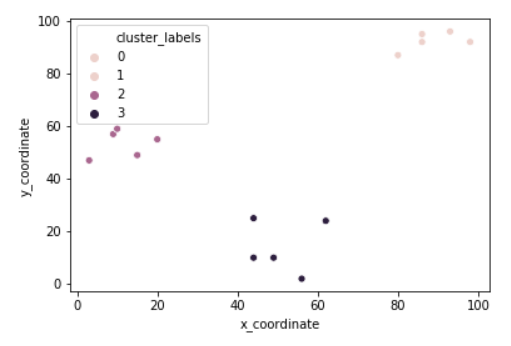
x_coordinates = [80.1, 93.1, 86.6, 98.5, 86.4, 9.5, 15.2, 3.4,
                 10.4, 20.3, 44.2, 56.8, 49.2, 62.5, 44.0]
y_coordinates = [87.2, 96.1, 95.6, 92.4, 92.4, 57.7, 49.4,
                 47.3, 59.1, 55.5, 25.6, 2.1, 10.9, 24.1, 10.3]

df = pd.DataFrame({'x_coordinate': x_coordinates,
                   'y_coordinate': y_coordinates})
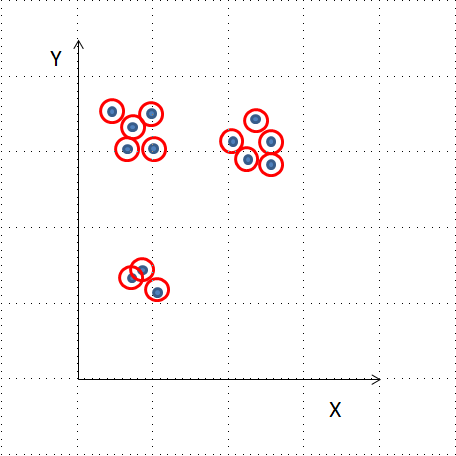
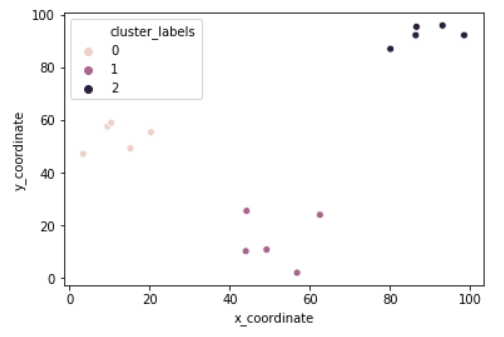
centroids,_ = kmeans(df, 3)
df['cluster_labels'], _ = vq(df, centroids)
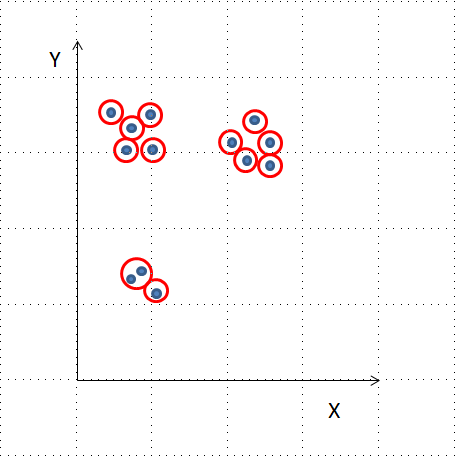
sns.scatterplot(x='x_coordinate', y='y_coordinate',
                hue='cluster_labels', data = df)
plt.show()