Analyzing difference in proportions A/B tests
A/B-testen in Python

Moe Lotfy, PhD
Principal Data Science Manager
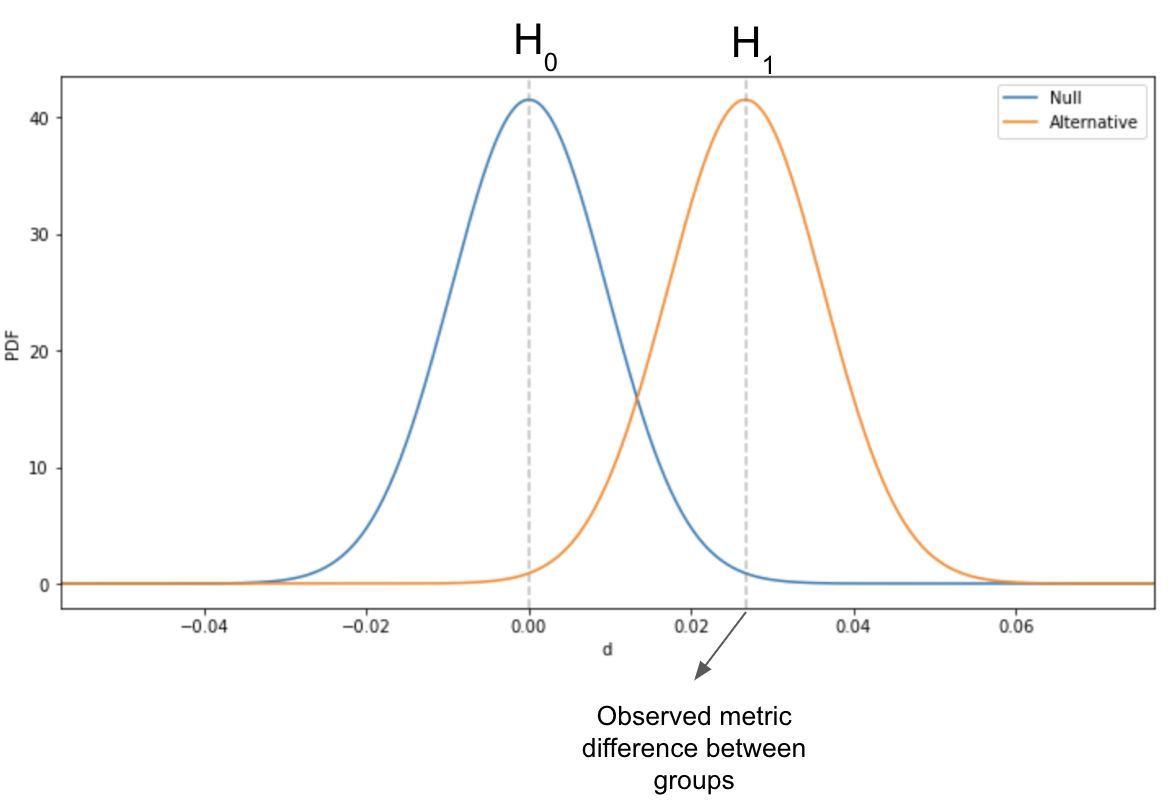
Kader voor verschil in proporties
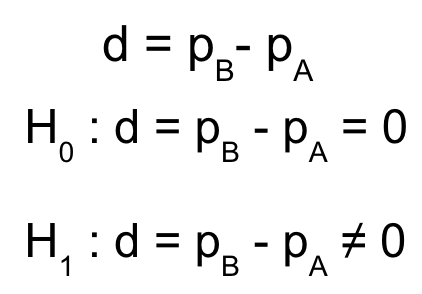
- Als p-waarde < $\alpha$
- Verwerp nulhypothese
Als p-waarde > $\alpha$
- Verwerp nulhypothese niet
Betrouwbaarheidsintervallen
- 95%-BI is het bereik dat 95% van de tijd het werkelijke verschil bevat
- Als vissen met een net in plaats van een speer
- Gecentreerd rond het waargenomen verschil tussen treatment en control
z-toets voor twee proporties
from statsmodels.stats.proportion import proportions_ztest, proportion_confint
# Calculate the number of users in groups A and B
n_A = checkout[checkout['checkout_page'] == 'A']['user_id'].nunique()
n_B = checkout[checkout['checkout_page'] == 'B']['user_id'].nunique()
print('Group A users:',n_A)
print('Group B users:',n_B)
Group A users: 2940
Group B users: 2938
# Compute unique purchasers in each group
puchased_A = checkout[checkout['checkout_page'] == 'A'].groupby('user_id')['purchased'].max().sum()
purchased_B = checkout[checkout['checkout_page'] == 'B'].groupby('user_id')['purchased'].max().sum()
# Assign groups lists
purchasers_abtest = [puchased_A, purchased_B]
n_abtest = [n_A, n_B]
z-toets voor twee proporties
# Calculate p-value and confidence intervals
z_stat, pvalue = proportions_ztest(purchasers_abtest, nobs=n_abtest)
(A_lo95, B_lo95), (A_up95, B_up95) = proportion_confint(purchasers_abtest, nobs=n_abtest, alpha=0.05)
# Print the p-value and confidence intervals
print(f'p-value: {pvalue:.4f}')
print(f'Group A 95% CI : [{A_lo95:.4f}, {A_up95:.4f}]')
print(f'Group B 95% CI : [{B_lo95:.4f}, {B_up95:.4f}]')
p-value: 0.0058
Group A 95% CI : [0.8072, 0.8349]
Group B 95% CI : [0.8349, 0.8608]
Betrouwbaarheidsintervallen voor proporties
# Set random seed for repeatability
np.random.seed(34)
# Calculate the average purchase rate for group A
pop_mean = checkout[checkout['checkout_page'] == 'B']['purchased'].mean()
print(pop_mean)
0.847
Betrouwbaarheidsintervallen voor proporties
# Calculate 20 90% confidence intervals for 20 random samples of size 100 each
for i in range(20):
    confidence_interval = proportion_confint(
        count = checkout[checkout['checkout_page'] == 'B'].sample(100)['purchased'].sum(),
        nobs = 100,
        alpha = (1 - 0.90))
    print(confidence_interval)
(0.7912669777384846, 0.9087330222615153)
(0.8385342148455946, 0.9414657851544054)
(0.8265485838585659, 0.9334514161414341)
(0.7568067872454262, 0.8831932127545737)
(0.8506543911914558, 0.9493456088085442)*
(0.8385342148455946, 0.9414657851544054)
(0.7230037568938057, 0.8569962431061944)
(0.8146830076144598, 0.9253169923855402)
(0.8029257122801267, 0.9170742877198733)
(0.8146830076144598, 0.9253169923855402)
(0.8506543911914558, 0.9493456088085442)*
(0.7454722433688197, 0.8745277566311804)
...
Laten we oefenen!
A/B-testen in Python

