Introductie tot tijdreeksen en stationariteit
ARIMA-modellen in Python

James Fulton
Climate informatics researcher
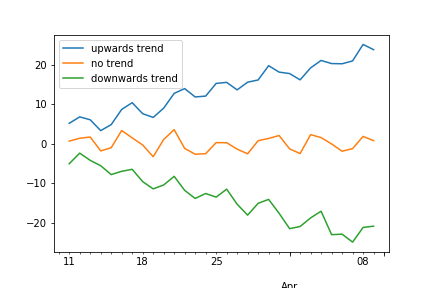
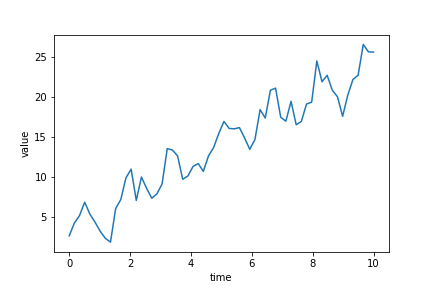
Trend
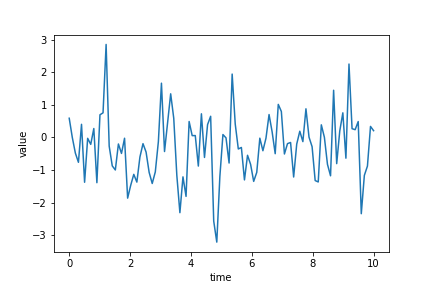
fig, ax = plt.subplots()
df.plot(ax=ax)
plt.show()
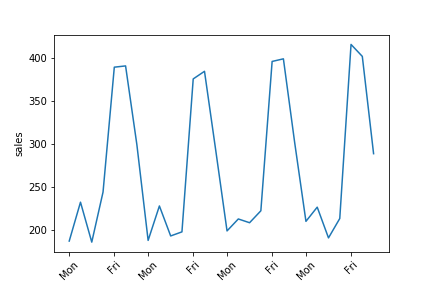
Seizoenspatroon
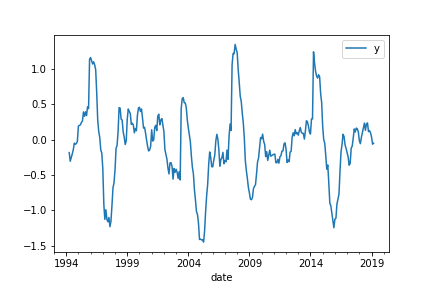
Cyclisch gedrag
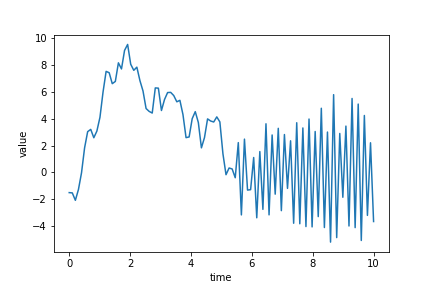
Stationariteit
Stationair
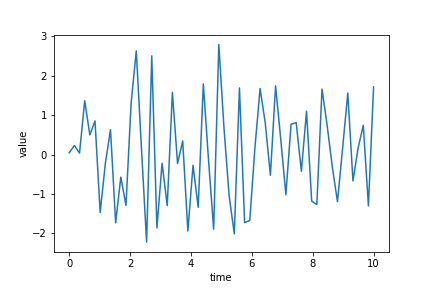
- Trend-stationair: trend is nul
Niet-stationair
Stationariteit
Stationair
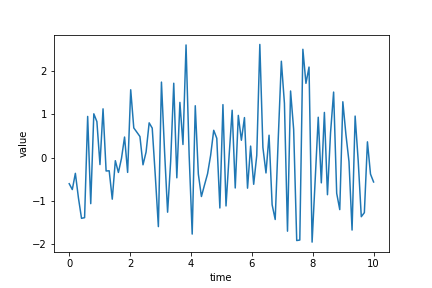
- Trend-stationair: trend is nul
- Variantie is constant
Niet-stationair
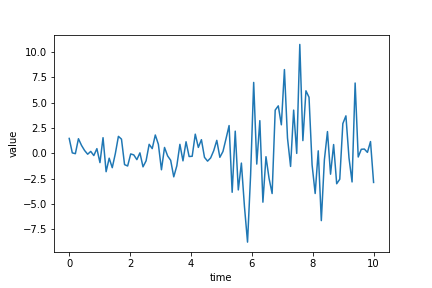
Stationariteit
Stationair
- Trend-stationair: trend is nul
- Variantie is constant
- Autocorrelatie is constant
Niet-stationair