Introductie tot de normale verdeling
Statistisch denken in Python (deel 1)

Justin Bois
Teaching Professor at the California Institute of Technology
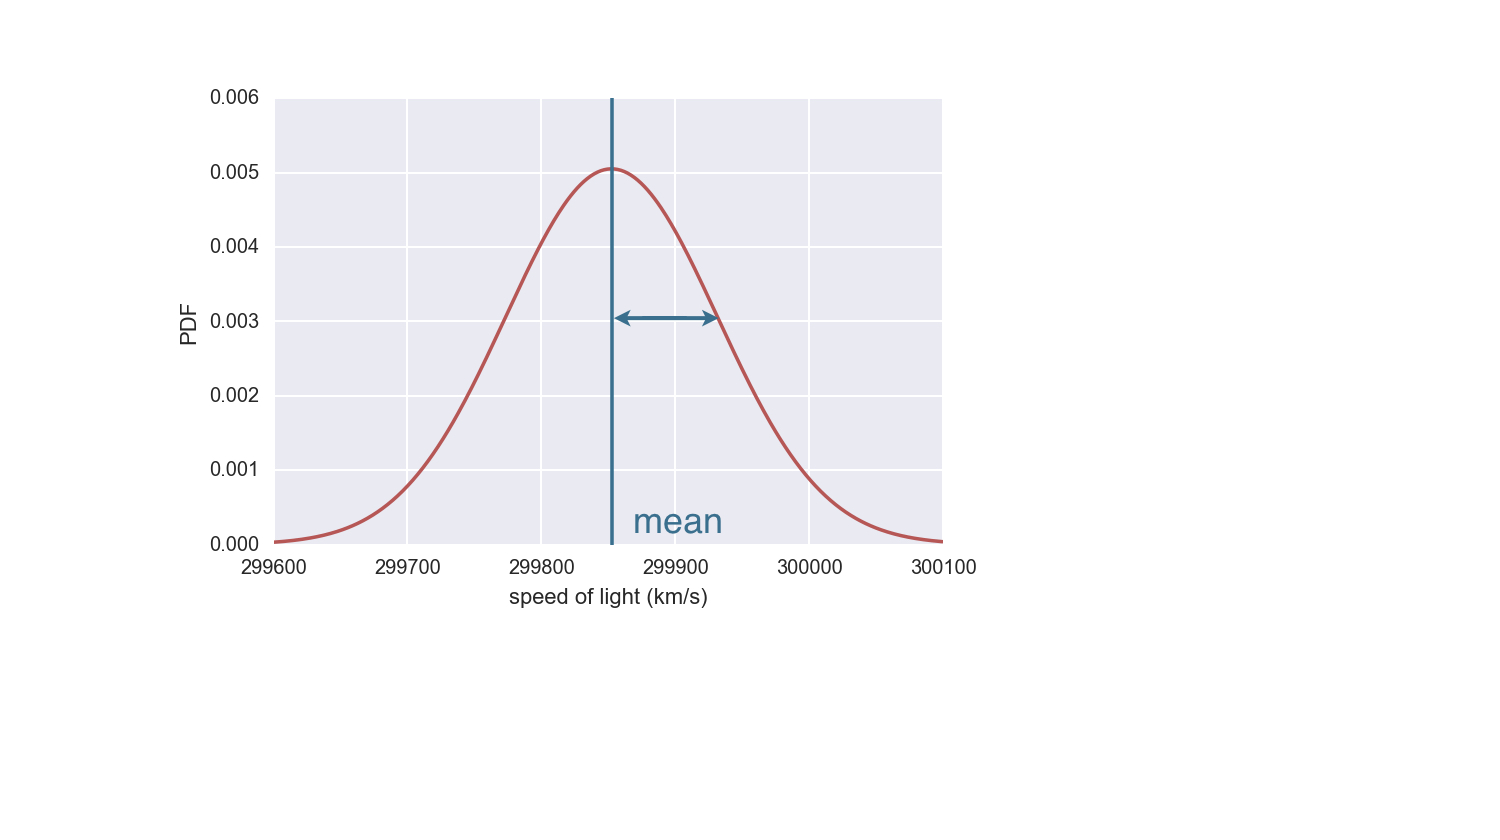
Normale verdeling
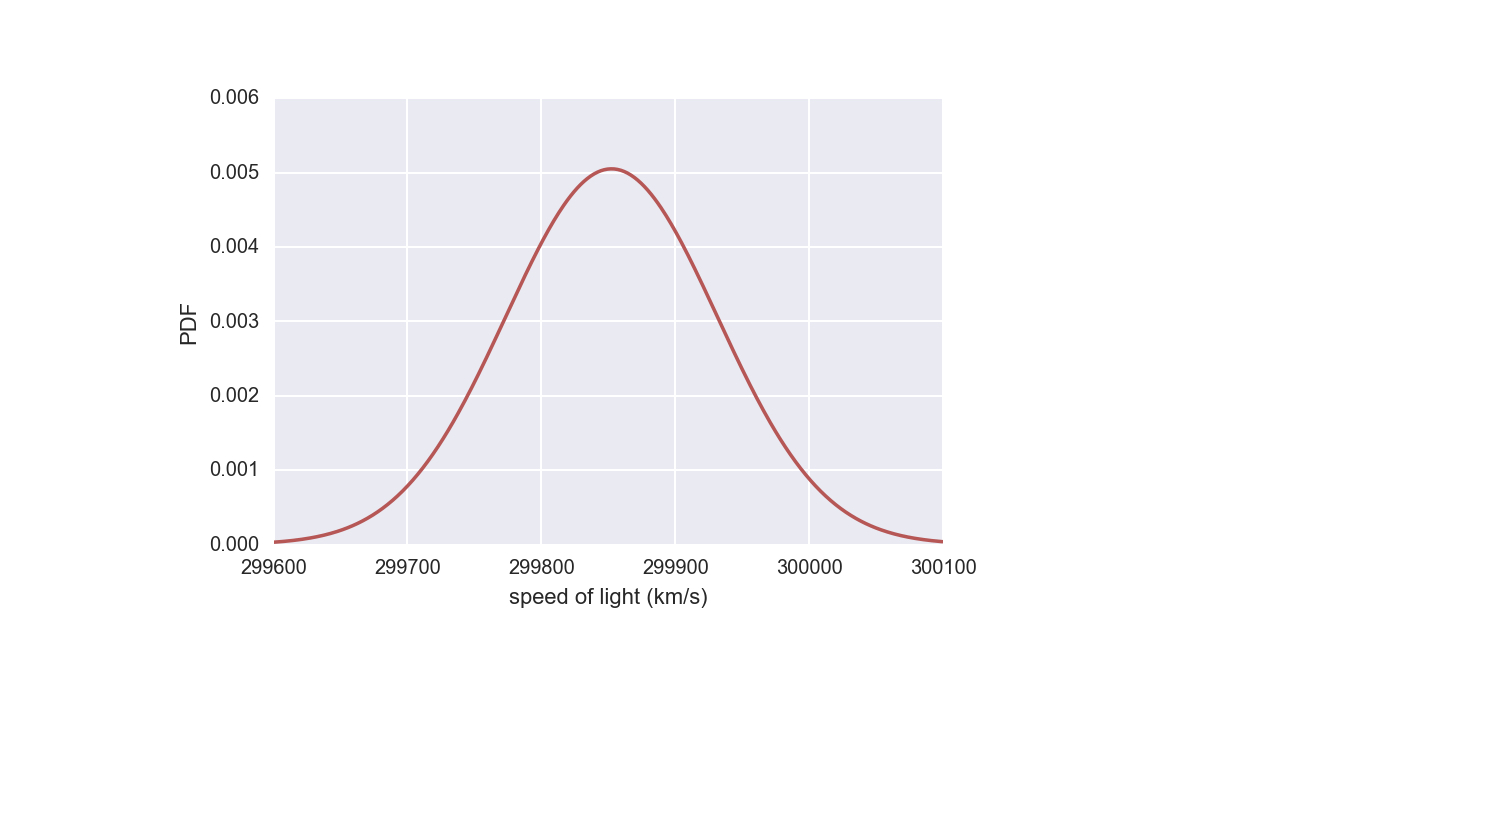
Normale verdeling
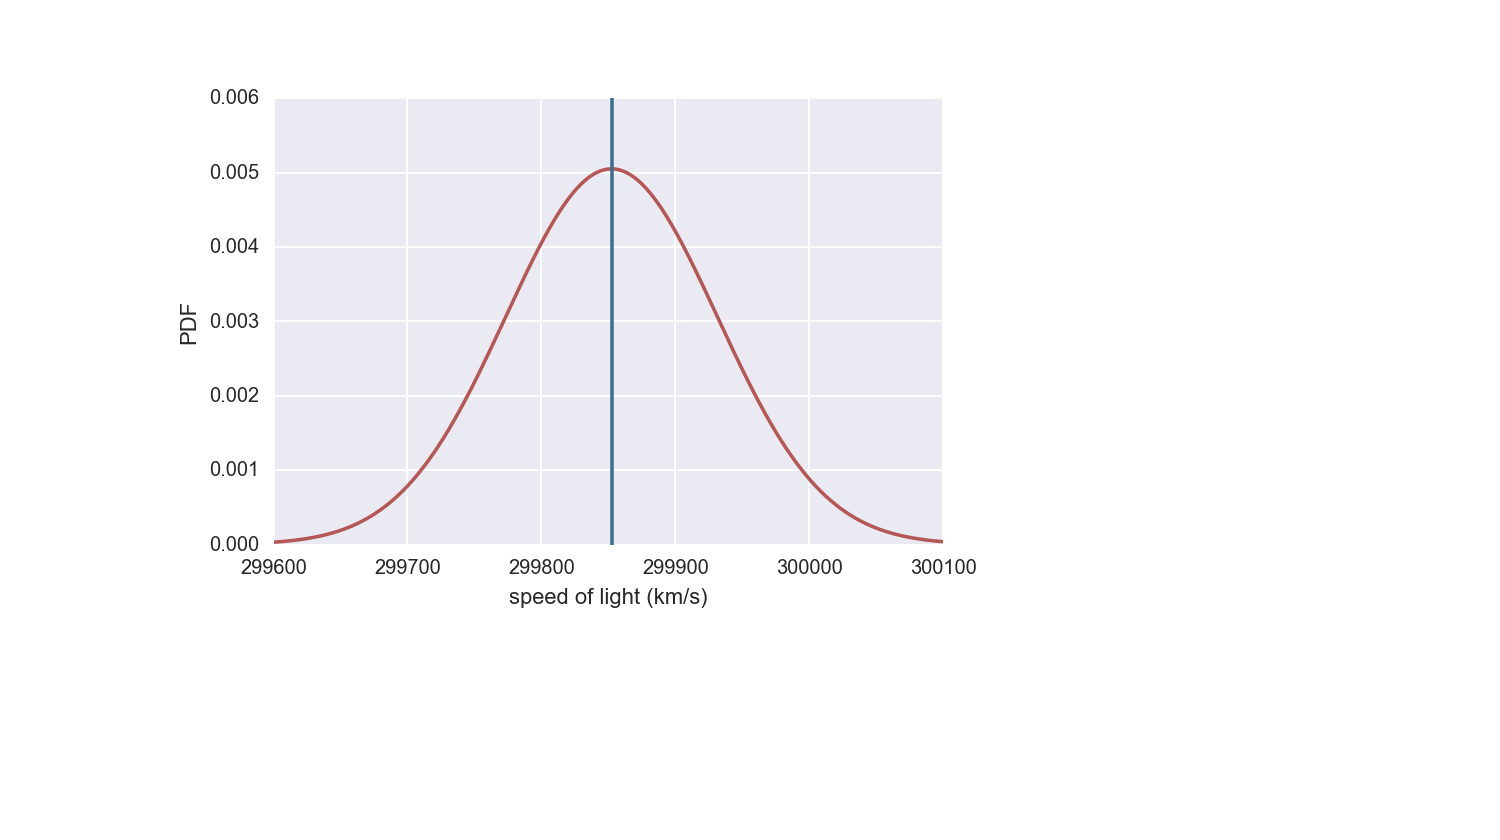
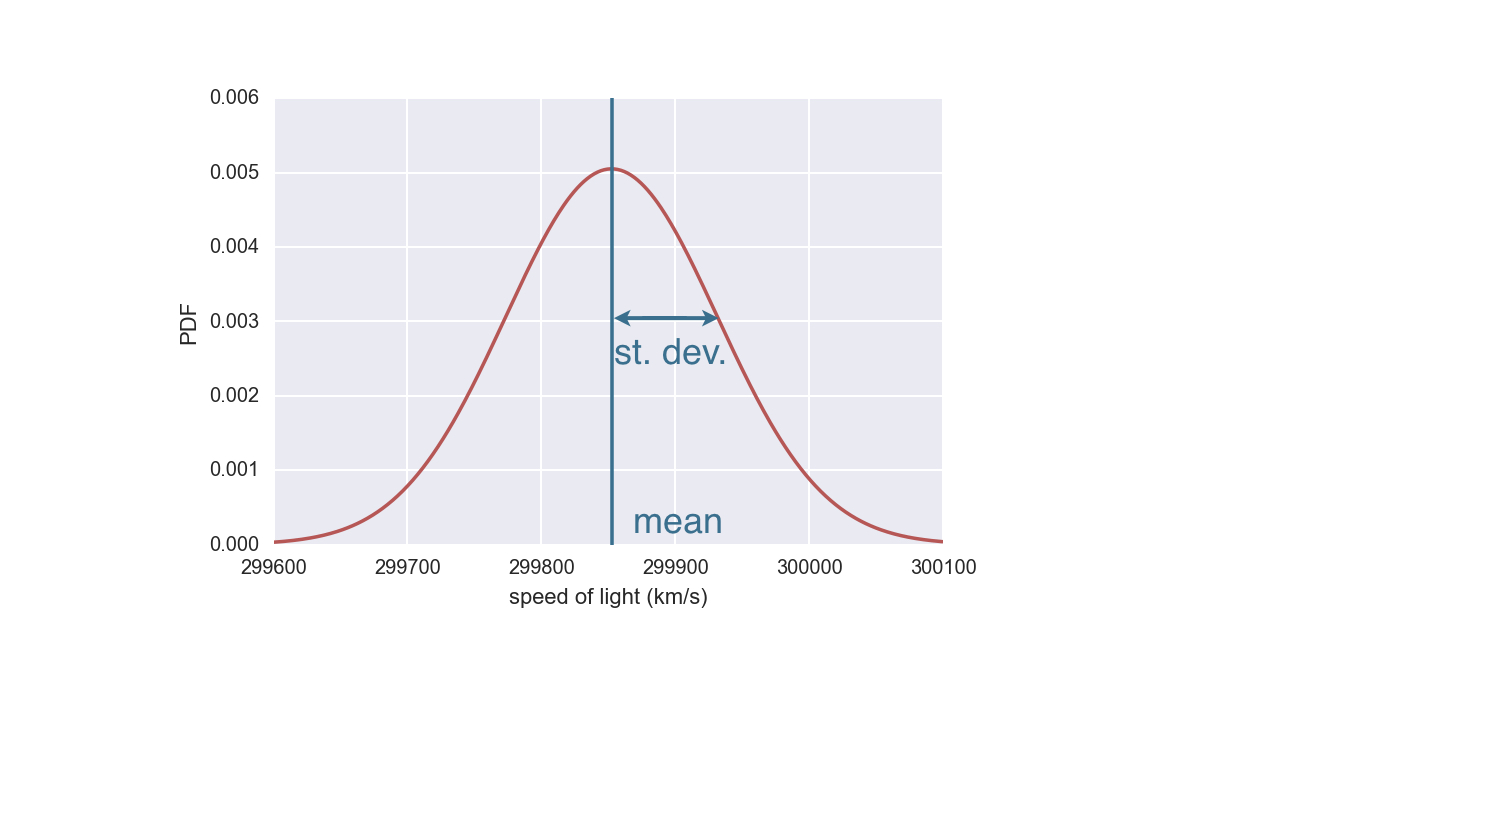
Normale verdeling
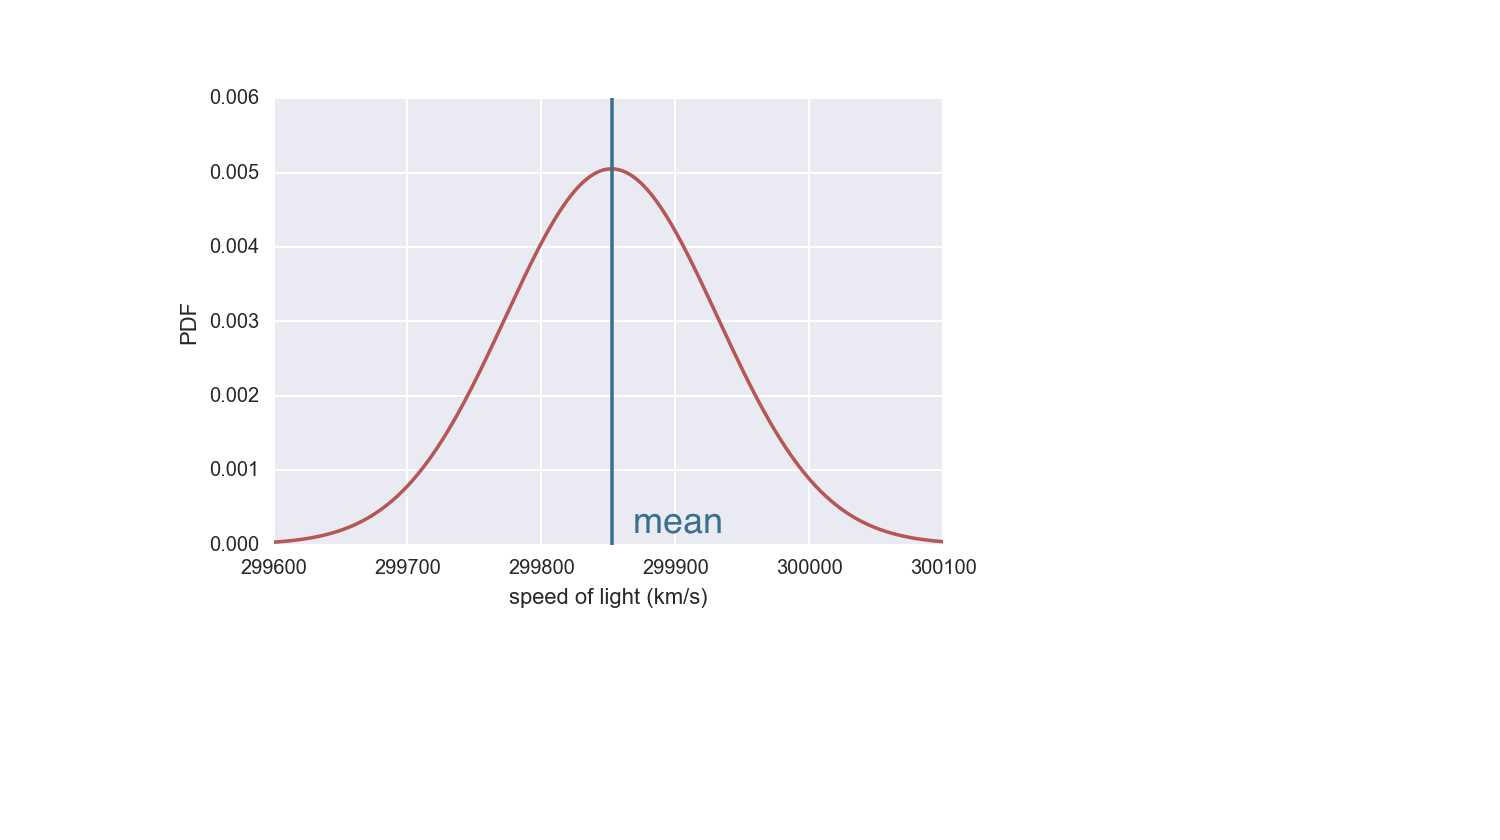
Normale verdeling
Normale verdeling
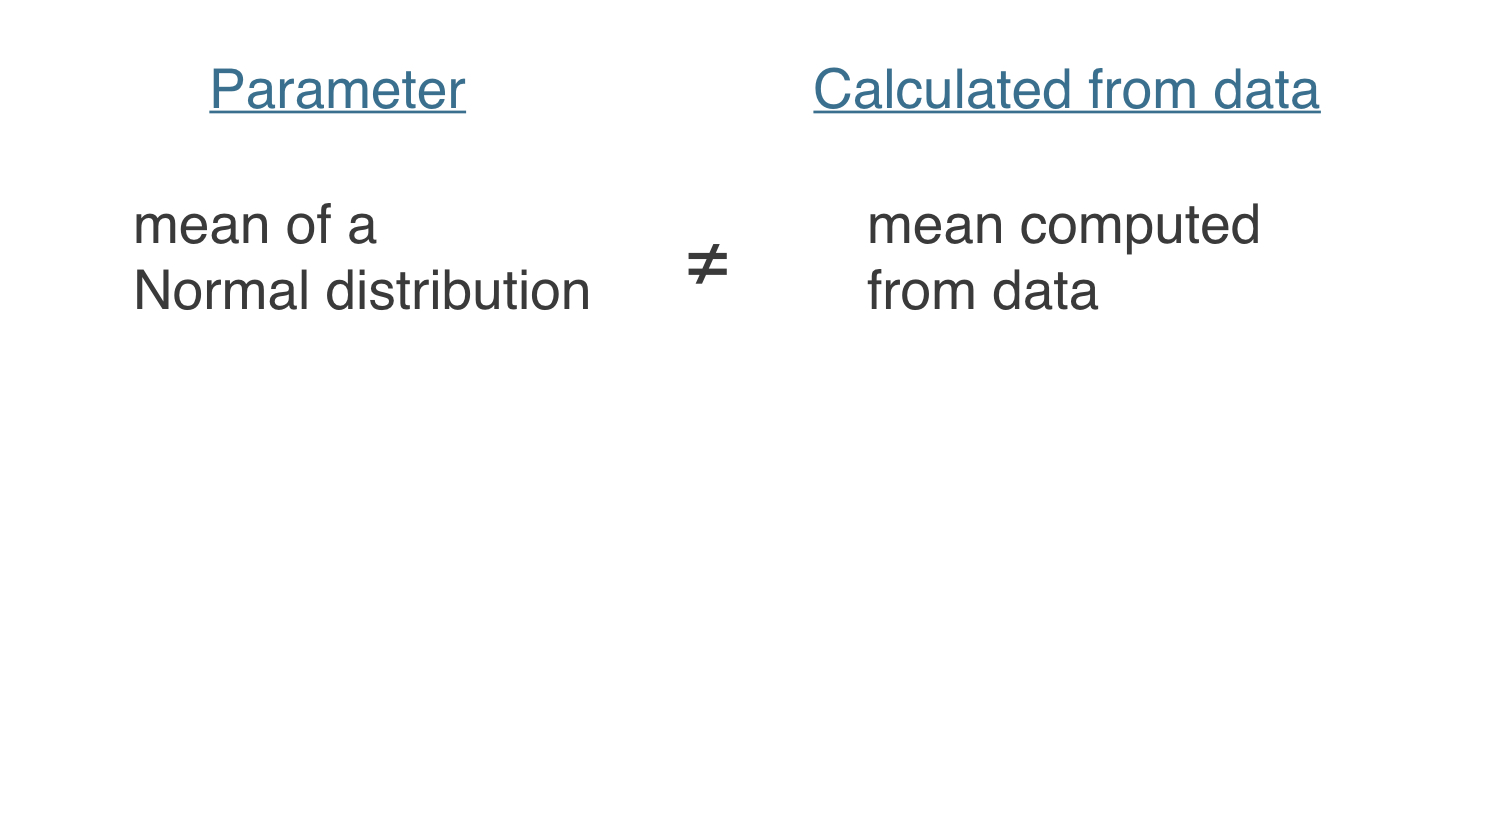
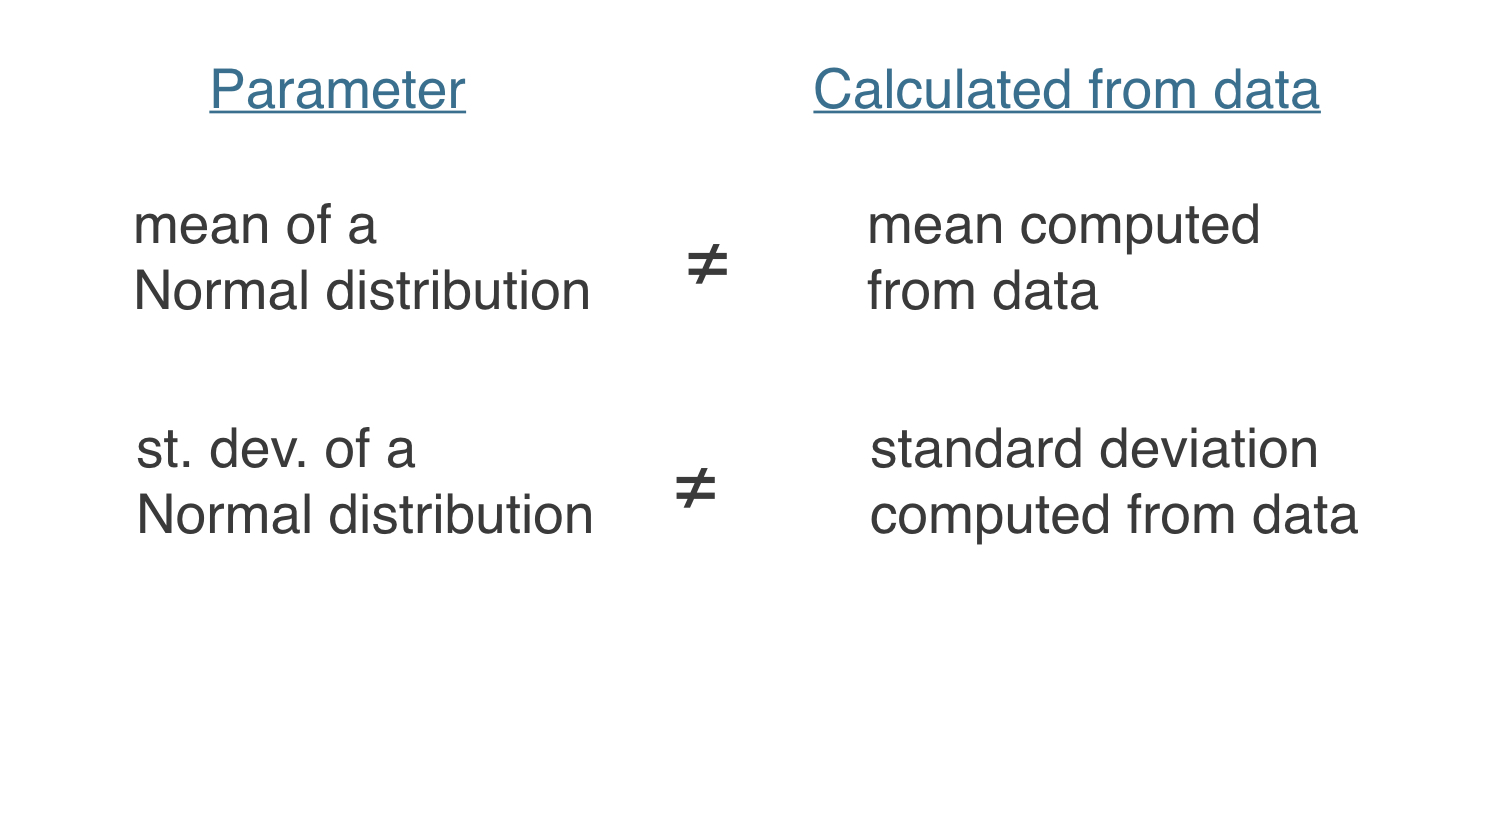
Data vergelijken met een normale PDF
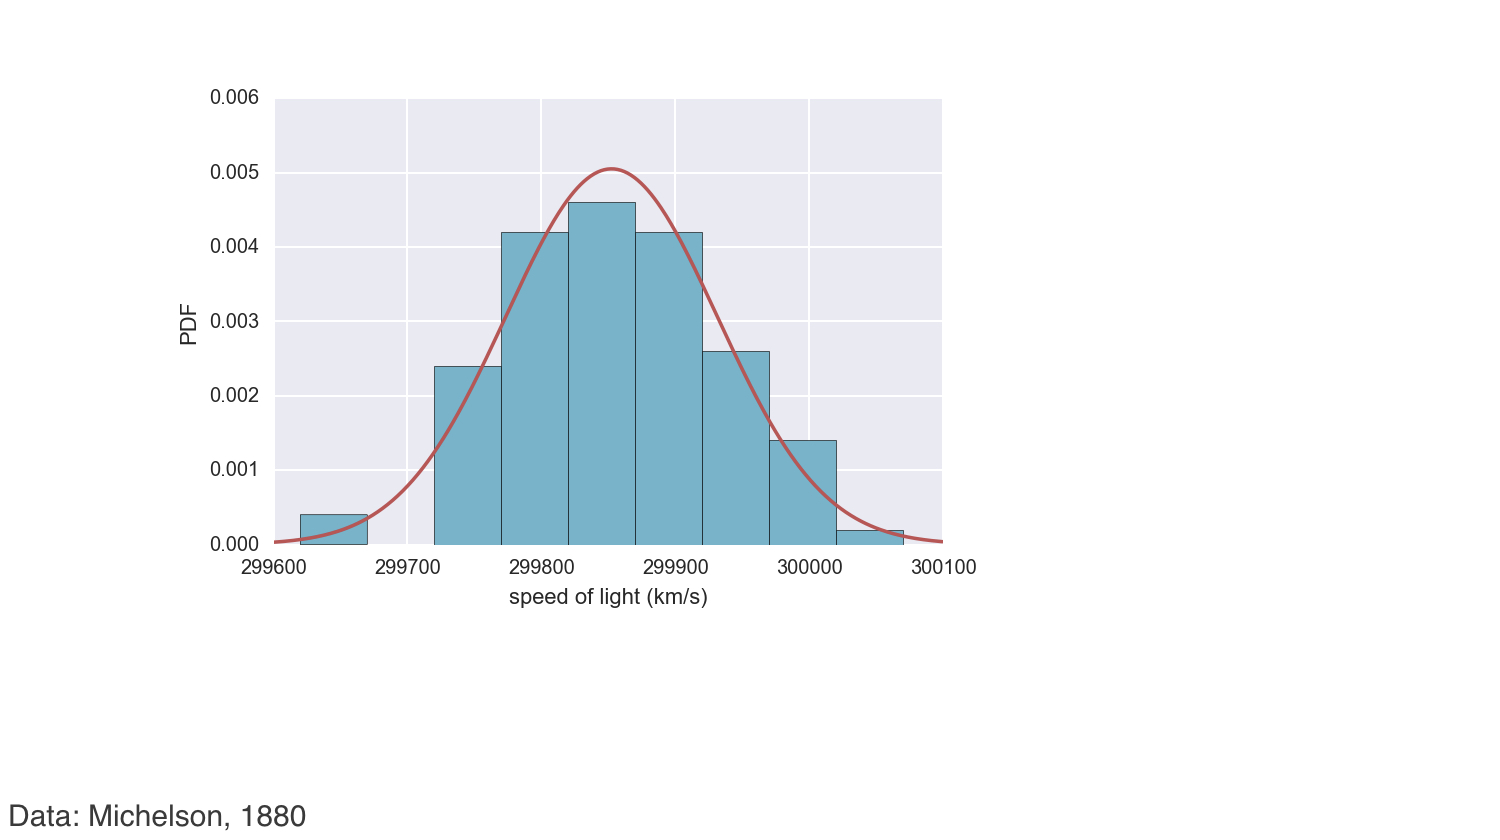
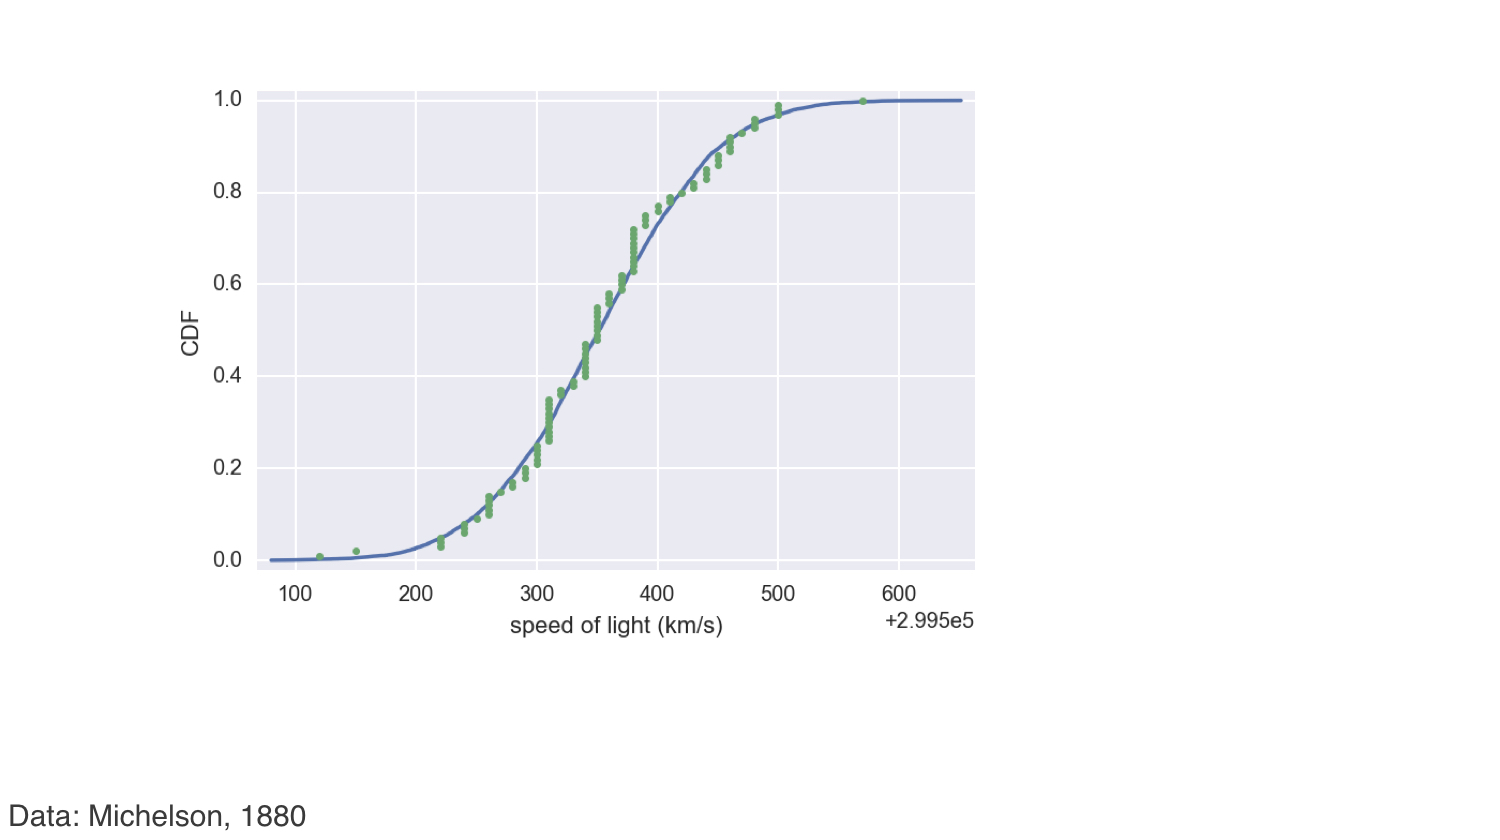
Normaliteit van Michelson-data controleren