Dashboards bouwen met Dash en Plotly
Alex Scriven
Data Scientist
HTML: taal voor het structureren van websites


dash.html als schakel tussen HTML en Python$$
Twee belangrijke HTML-structuren (‘tags’):
$$
style voorlopig — later meer over ‘CSS’!
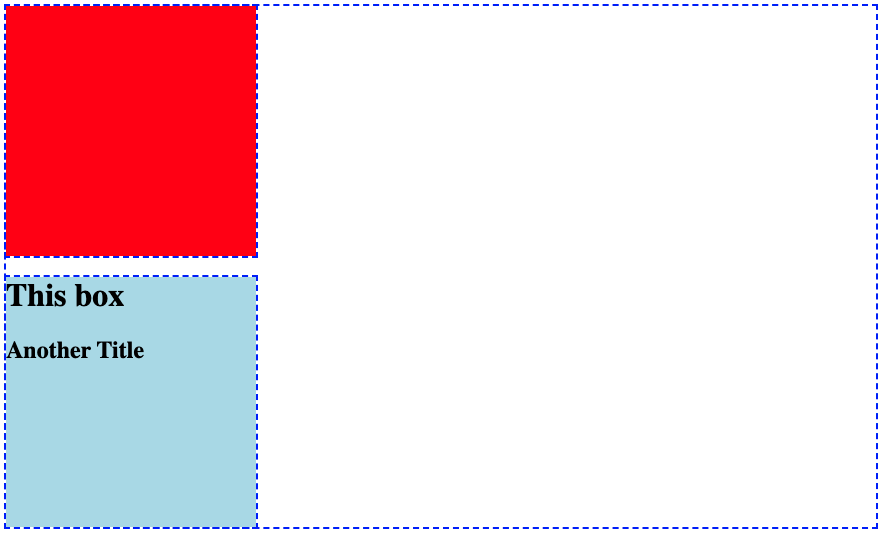
<div>
<div style="background-color: red;
width:250; height:250;">
</div>
<div style="background-color: lightblue;
width:250; height:250;">
<h1>This box</h1>
<h2>Another Title</h2>
</div>
</div>

Let op:
from dash import Dash, html
app = Dash()
app.layout = [
html.Div(style={'height':250, 'width':250, 'background-color':'red'}),
html.Div(children=[
html.H1("This box"),
html.H2("Another Title")],
style={'background-color':'lightblue'})
]
html.()html.Div() = <div>html.H1() = <h1>children-argumentdcc.Graph()-componenten erin zetten!
from dash import Dash, html
app.layout = [
html.Div(
style={'background-color':'red',
'height':250, 'width':250}),
html.Div(
children=[
html.H1("This box"),
html.H2("Another Title")]
,style={'background-color':'lightblue',
'height':250, 'width':250})
]
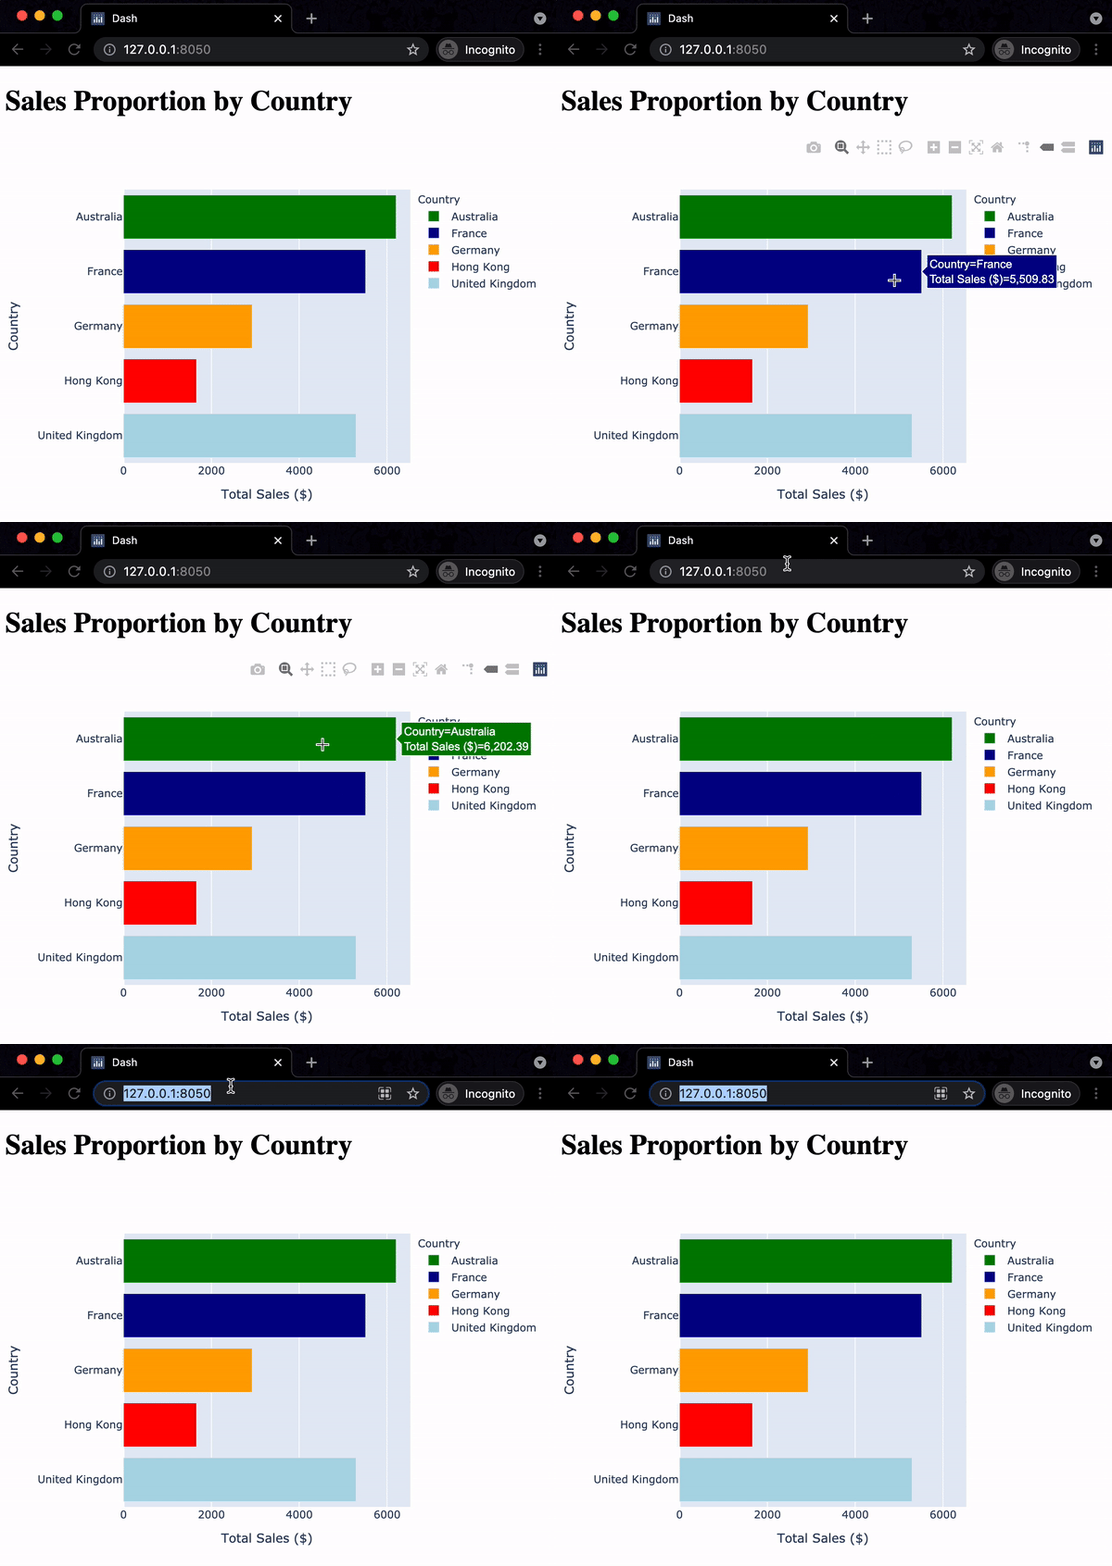
bar_fig_country = px.bar(ecom_sales, x='Total Sales ($)', y='Country', color='Country', color_discrete_map= {'United Kingdom':'lightblue', 'Germany':'orange', 'France':'darkblue', 'Australia':'green', 'Hong Kong':'red'}) app = Dash()app.layout = [ html.H1("Sales Proportion by Country"), dcc.Graph(id='bar_graph', figure=bar_fig_country) ]

$$
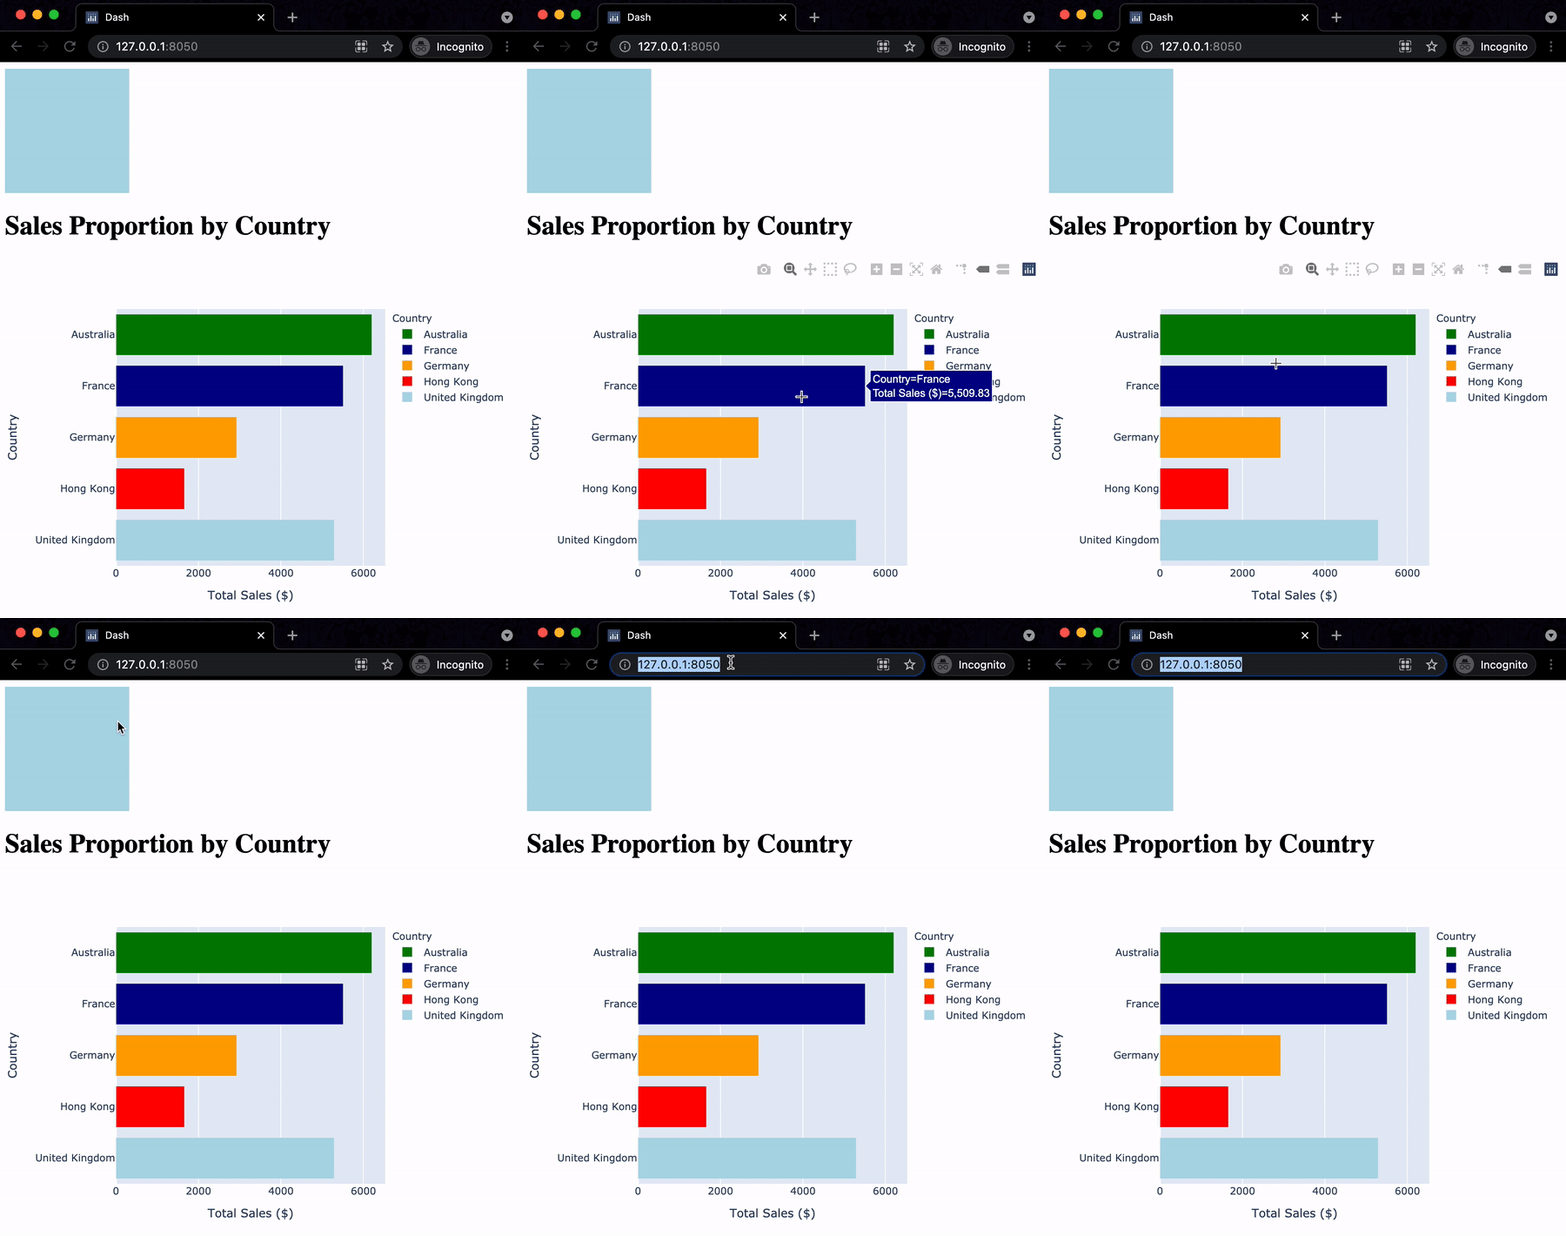
app.layout = [
html.Div(style={
'width':150,'height':150,
'background-color':'lightblue'}),
html.H1("Sales Proportion by Country"),
dcc.Graph(id='bar_graph',
figure=bar_fig_country)
]
$$

Dashboards bouwen met Dash en Plotly