Van Plotly naar Dash
Dashboards bouwen met Dash en Plotly

Alex Scriven
Data Scientist
Onze app
Toegang via een browser zoals Google Chrome
Terwijl de server draait, de
.py-file updaten en opslaan om live updates te zien in de browser

Onze app in de browser
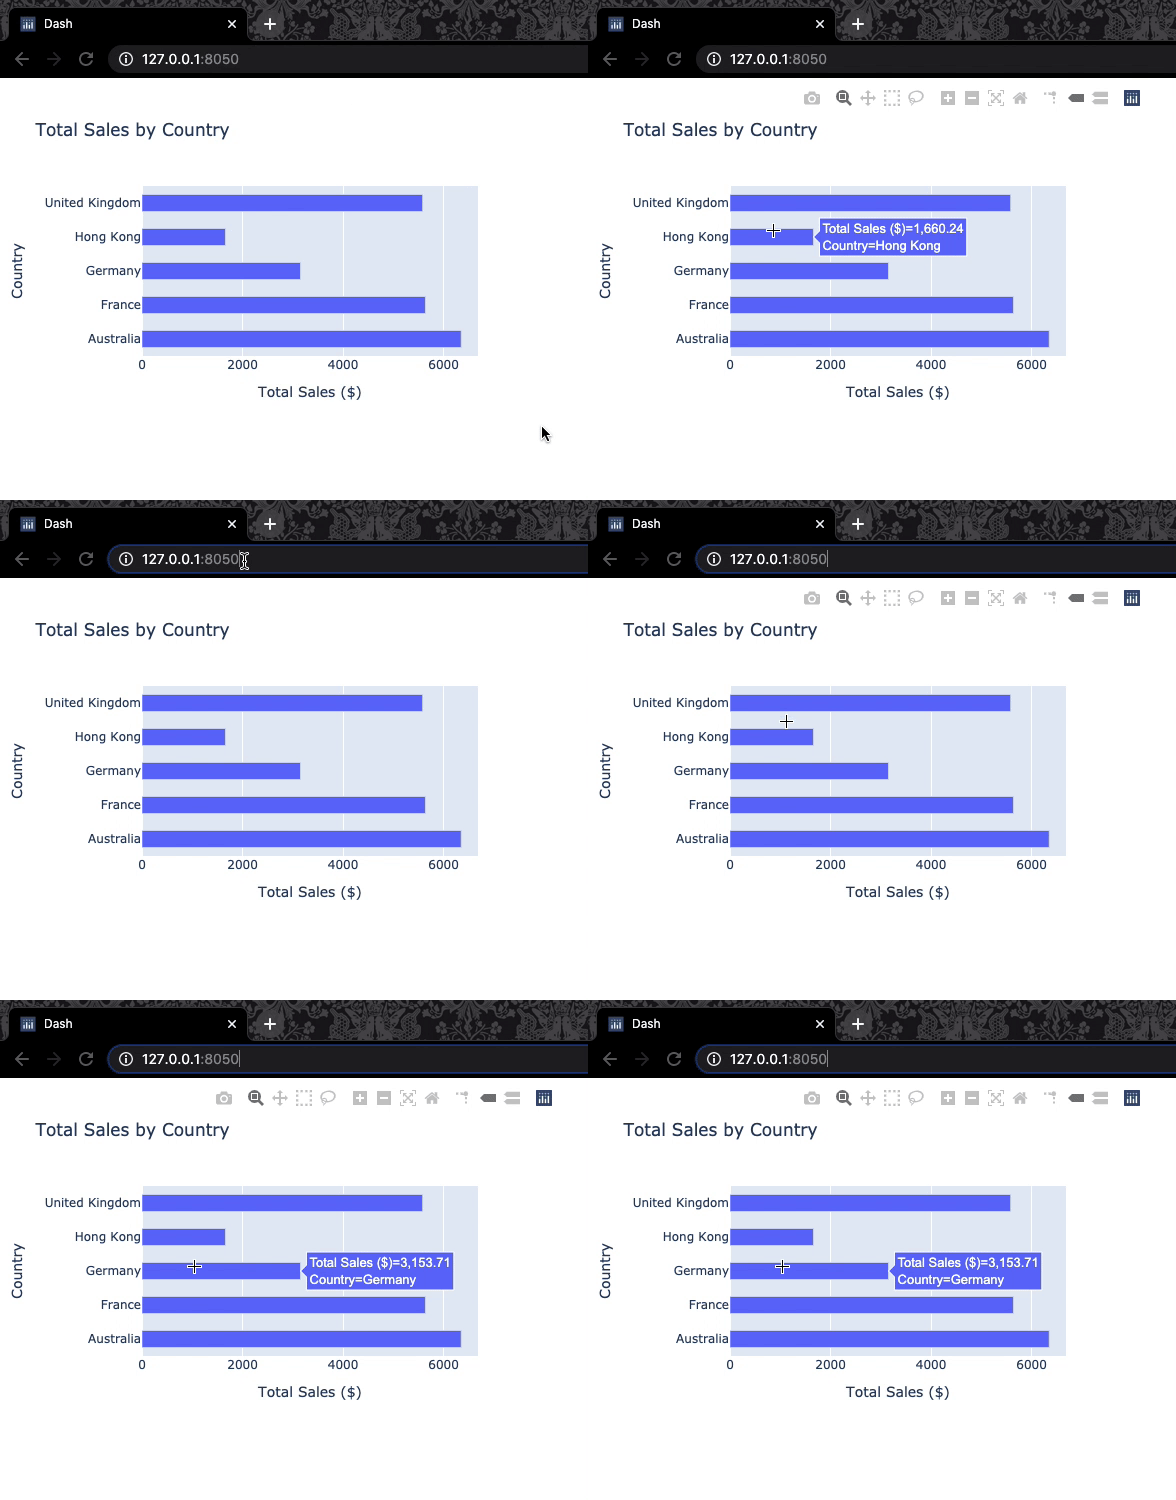
Dash in DataCamp
- Enkele verschillen met andere DataCamp-oefeningen:
- Setuplijnen bovenaan de oefening
- Alles wordt in één keer uitgevoerd (niet regel-voor-regel)
- (Veel) langere code
- Volwaardige dashboards (vergroot het venster!)


