Trendindicator: MAs
Financieel traden in Python

Chelsea Yang
Data Science Instructor
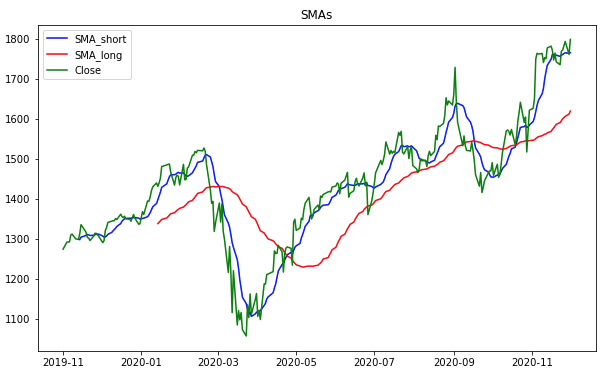
SMA plotten
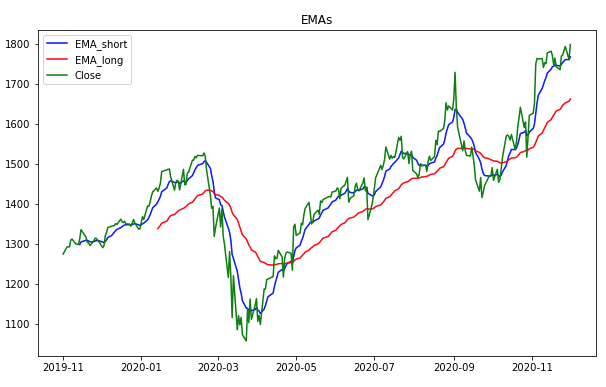
EMA plotten
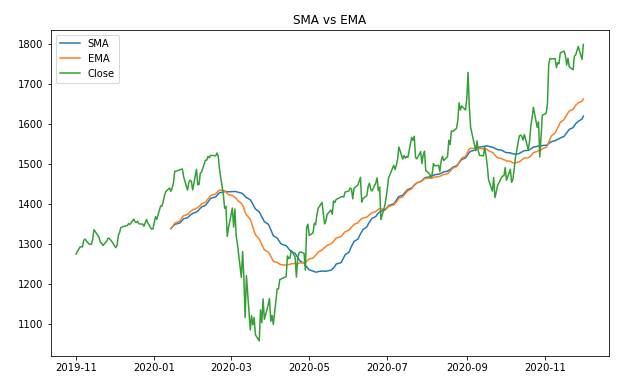
SMA vs. EMA
EMA reageert sterker op de meest recente prijsbeweging
Financieel traden in Python
Chelsea Yang
Data Science Instructor
EMA reageert sterker op de meest recente prijsbeweging

