Sterkte-indicator: ADX

Financieel traden in Python

Chelsea Yang

Data Science Instructor

Wat is ADX?

  • Staat voor "Average Directional Movement Index"
  • Ontwikkeld door J. Welles Wilder
    • "New Concepts in Technical Systems" (1987)
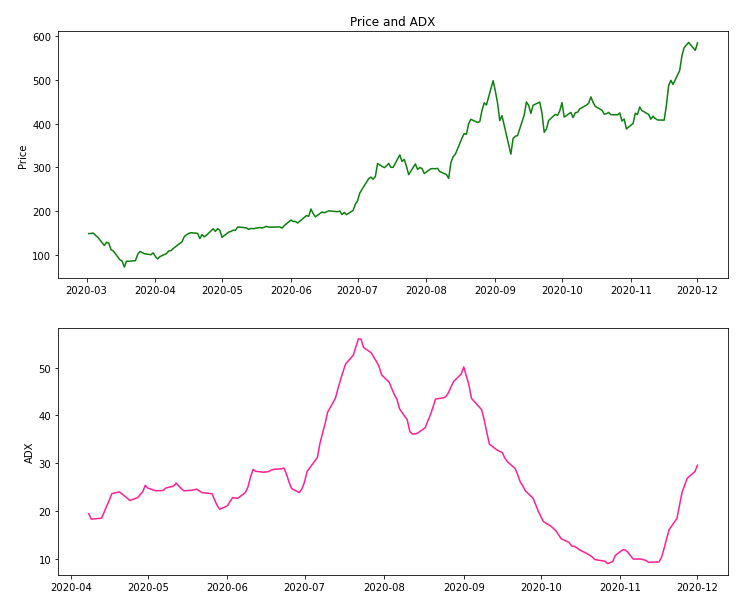
Boek van Welles Wilder

  • Meet de sterkte van een trend
    • Schommelt tussen 0 en 100
    • ADX <= 25: geen trend
    • ADX > 25: trendmarkt
    • ADX > 50: sterke trendmarkt
Financieel traden in Python

Hoe wordt ADX berekend?

  • Afgeleid van de gesmoothed gemiddelden van het verschil tussen +DI en -DI
    • +DI (Plus Directional Index): kwantificeert een opwaartse trend
    • -DI (Minus Directional Index): kwantificeert een neerwaartse trend


  • Invoer voor berekening:
    • high-, low- en slotkoersen per periode
Financieel traden in Python

ADX in Python implementeren

# Calculate ADX
stock_data['ADX'] = talib.ADX(stock_data['High'], stock_data['Low'], stock_data['Close'],
                              timeperiod=14)

# Print the last five rows print(stock_data.tail())
             Open   High    Low  Close   ADX
Date                                        
2020-11-24 540.40 559.99 526.20 555.38 21.16
2020-11-25 550.06 574.00 545.37 574.00 23.92
2020-11-27 581.16 598.78 578.45 585.76 26.82
2020-11-30 602.21 607.80 554.51 567.60 28.25
2020-12-01 597.59 597.85 572.05 584.76 29.58
Financieel traden in Python

ADX plotten

import matplotlib.pyplot as plt

# Create subplots
fig, (ax1, ax2) = plt.subplots(2)

# Plot ADX with the price ax1.set_ylabel('Price') ax1.plot(stock_data['Close']) ax2.set_ylabel('ADX') ax2.plot(stock_data['ADX']) ax1.set_title('Price and ADX') plt.show()

Een koersgrafiek boven en een ADX-grafiek onder

Financieel traden in Python

Laten we oefenen!

Financieel traden in Python

Preparing Video For Download...