Alternatieven voor boxplots
Best practices voor visualisaties in R

Nick Strayer
Instructor
Beperkingen van boxplot met jitter
- Jitter kan beperkt overlap aan
- Dichtheid is lastig te zien
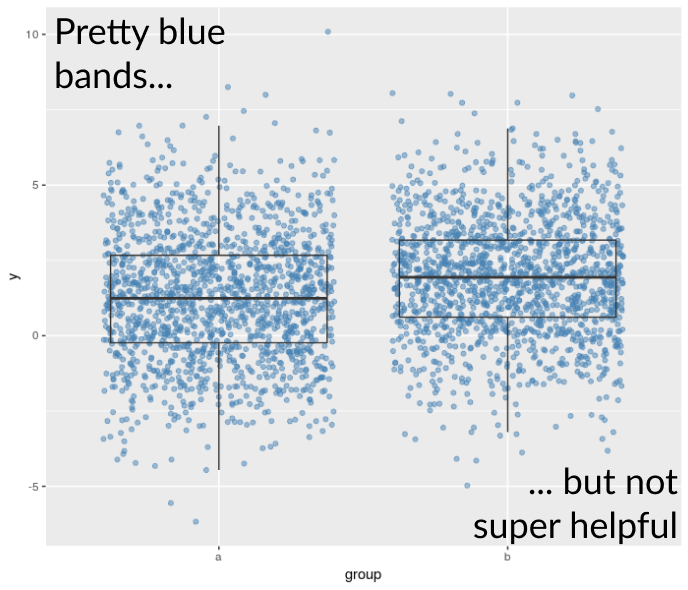
Wat zijn andere opties?
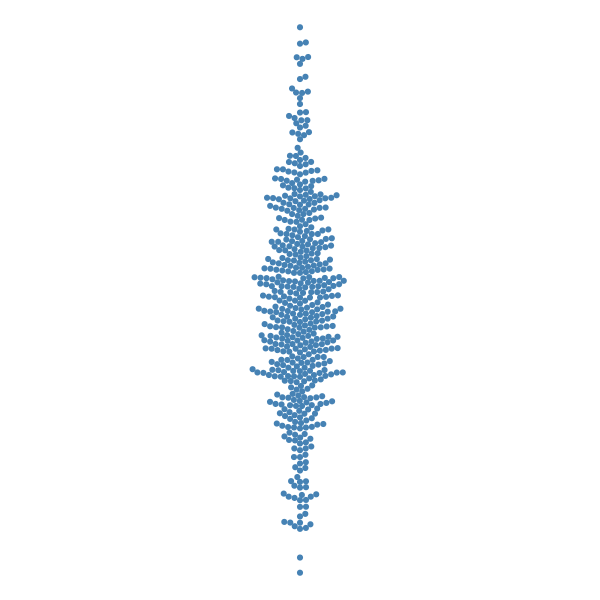
Beeswarmplots
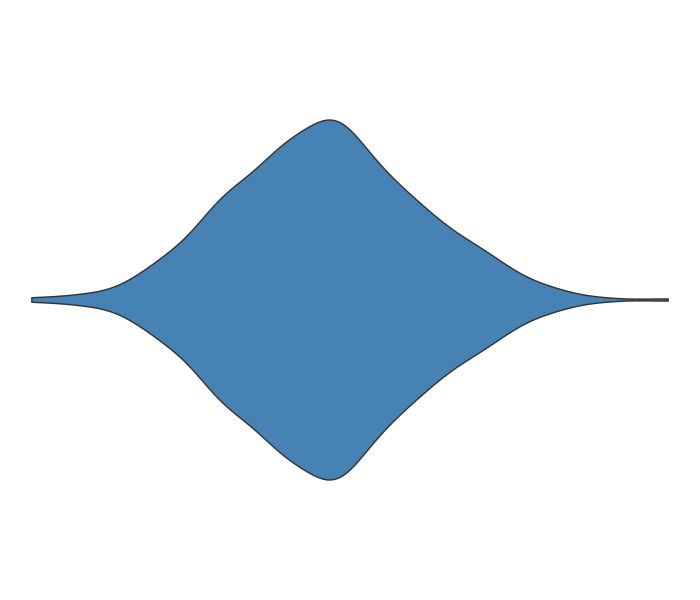
Violinplots

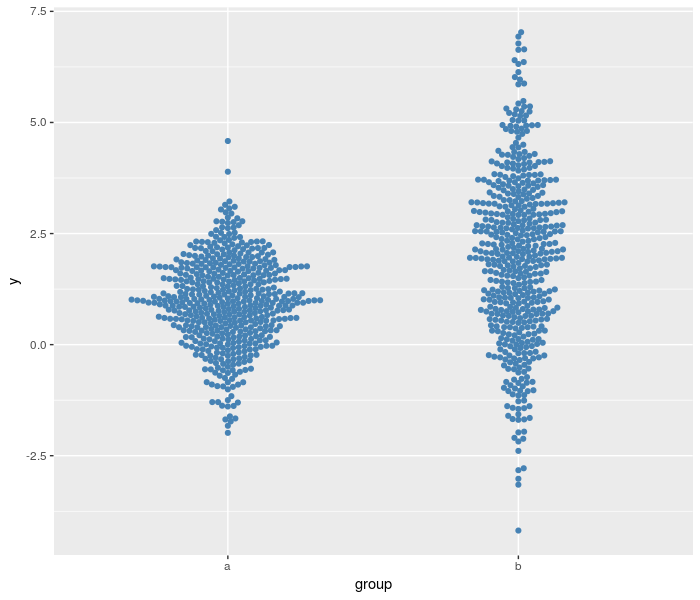
Beeswarm: pluspunten
- Individuele datapunten
- Vorm van de verdeling
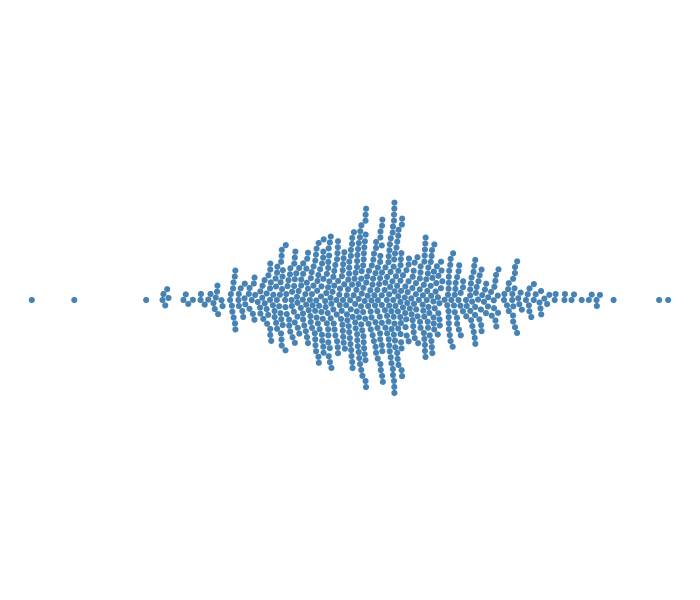
Beeswarm: minpunten
- Wordt lastig bij veel data
- Willekeurige stapeling

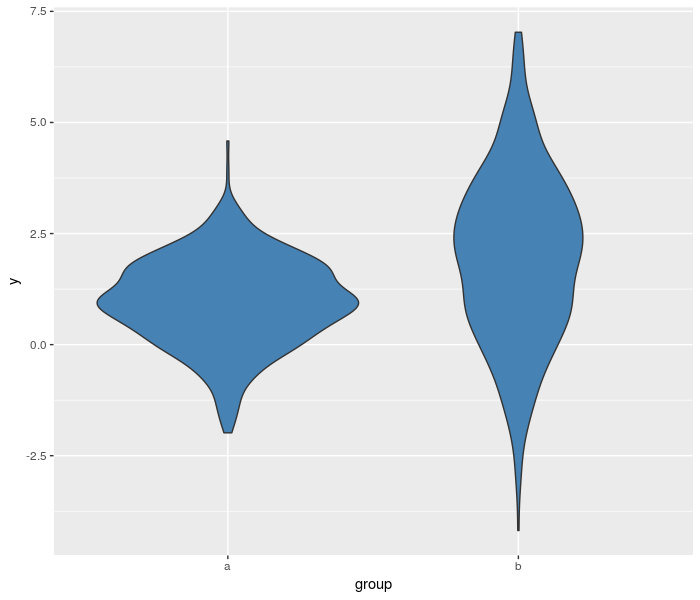
Violin: pluspunten
- Elk datapunt telt mee
- Niet elk punt is zichtbaar: goed bij veel data
Violin: minpunten
- Keuze van kernelbreedte
- Niet elk punt is zichtbaar