Verdelingen: deel één
Best practices voor visualisaties in R

Nick Strayer
Instructor
Wat zijn verdelingsdata?
- Meerdere ‘observaties’
- Meestal een steekproef uit een populatie

Waarom verdelingen belangrijk zijn
- Fouten bij verzamelen of opschonen worden zichtbaar
- Kan aangeven dat je in een model voor een variabele moet controleren
- Eerlijk blijven naar de data
Standaardplots
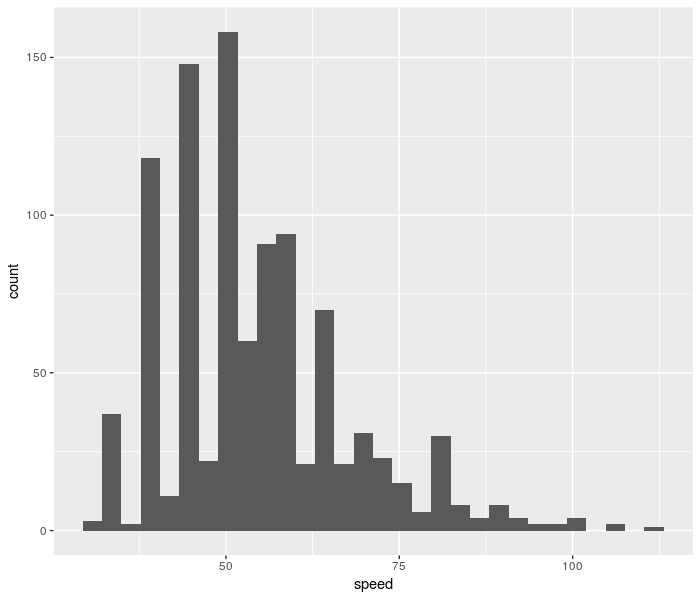
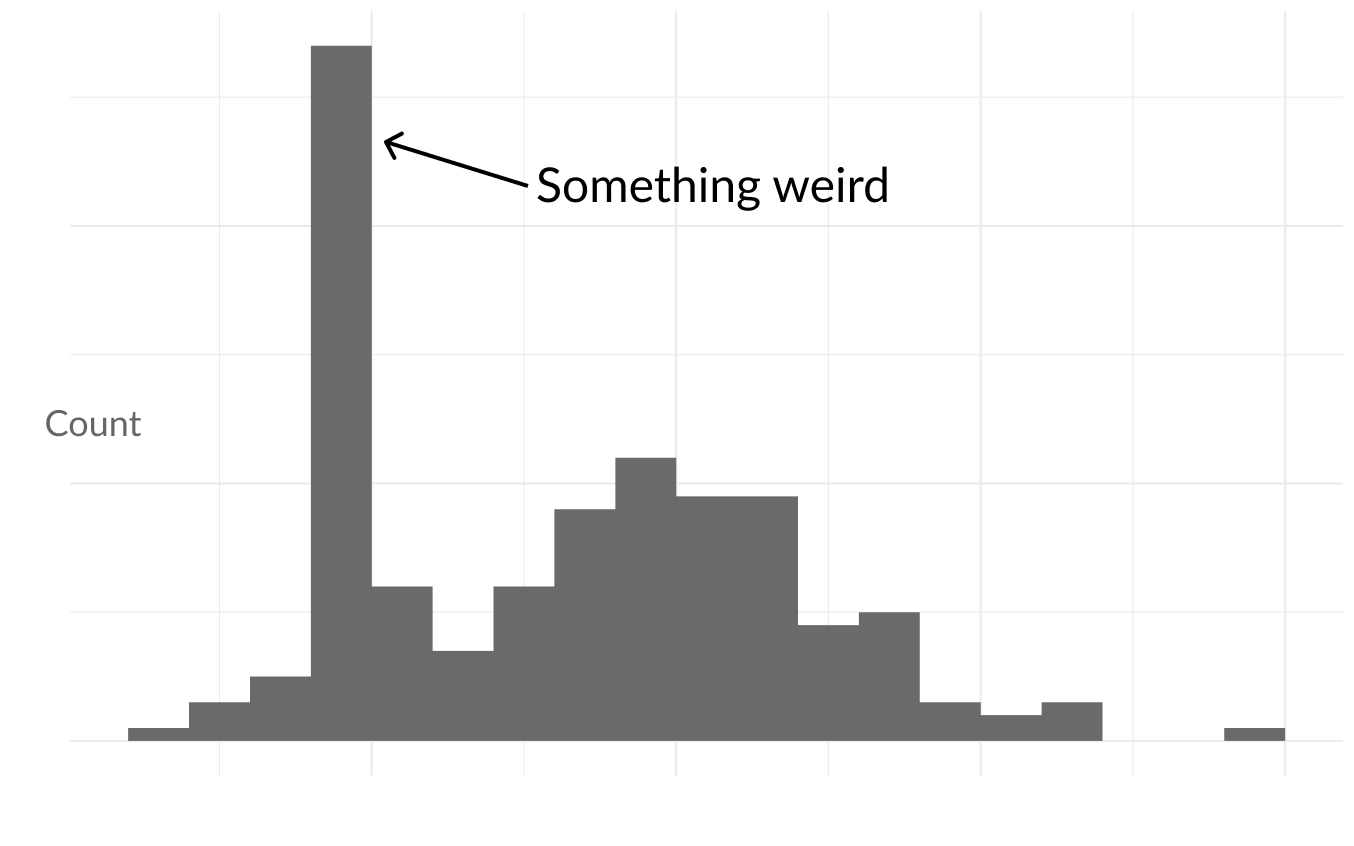
Histogram
- Goed voor één verdeling tegelijk
- In dit hoofdstuk

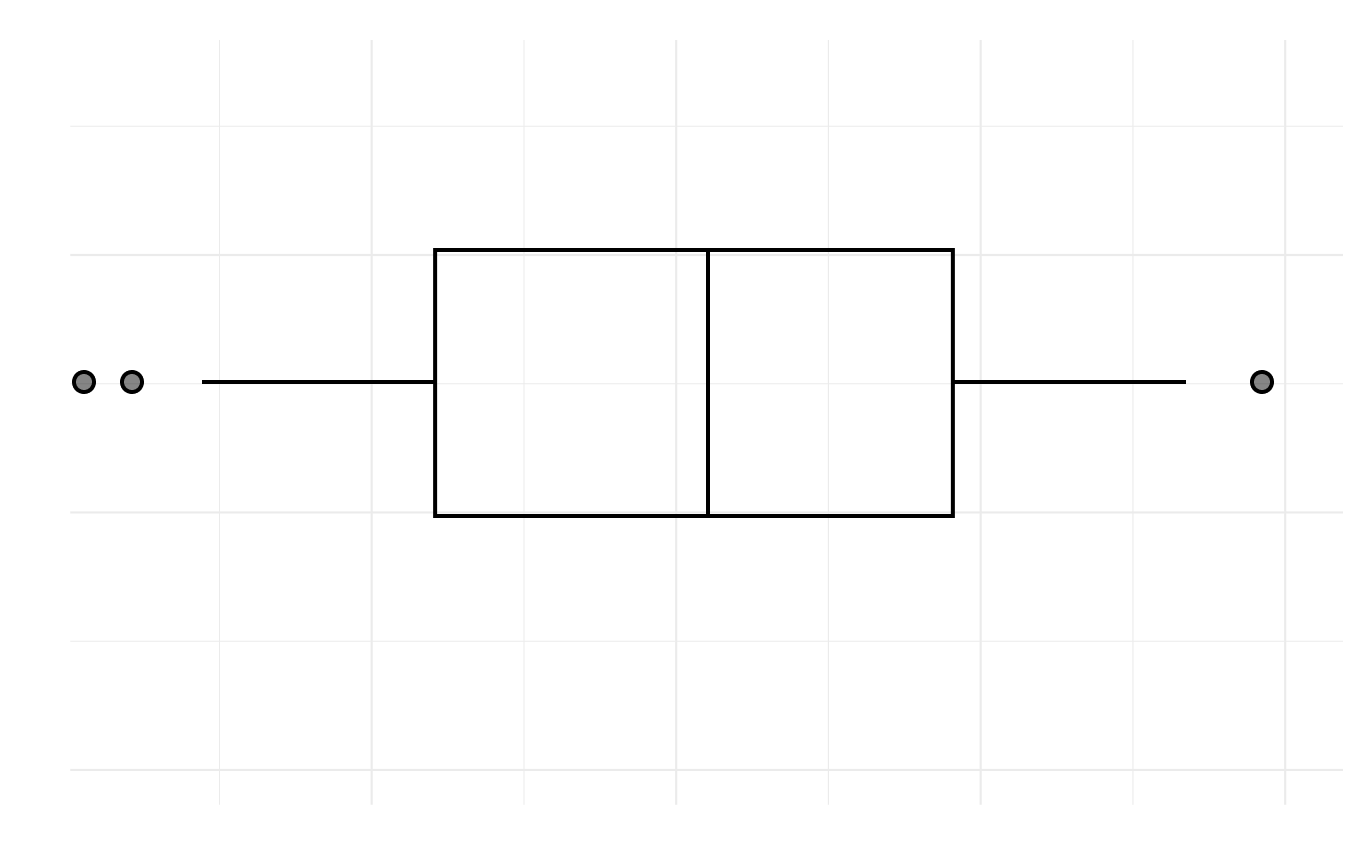
boxplot
- Voor meerdere verdelingen vergelijken
- Volgend hoofdstuk
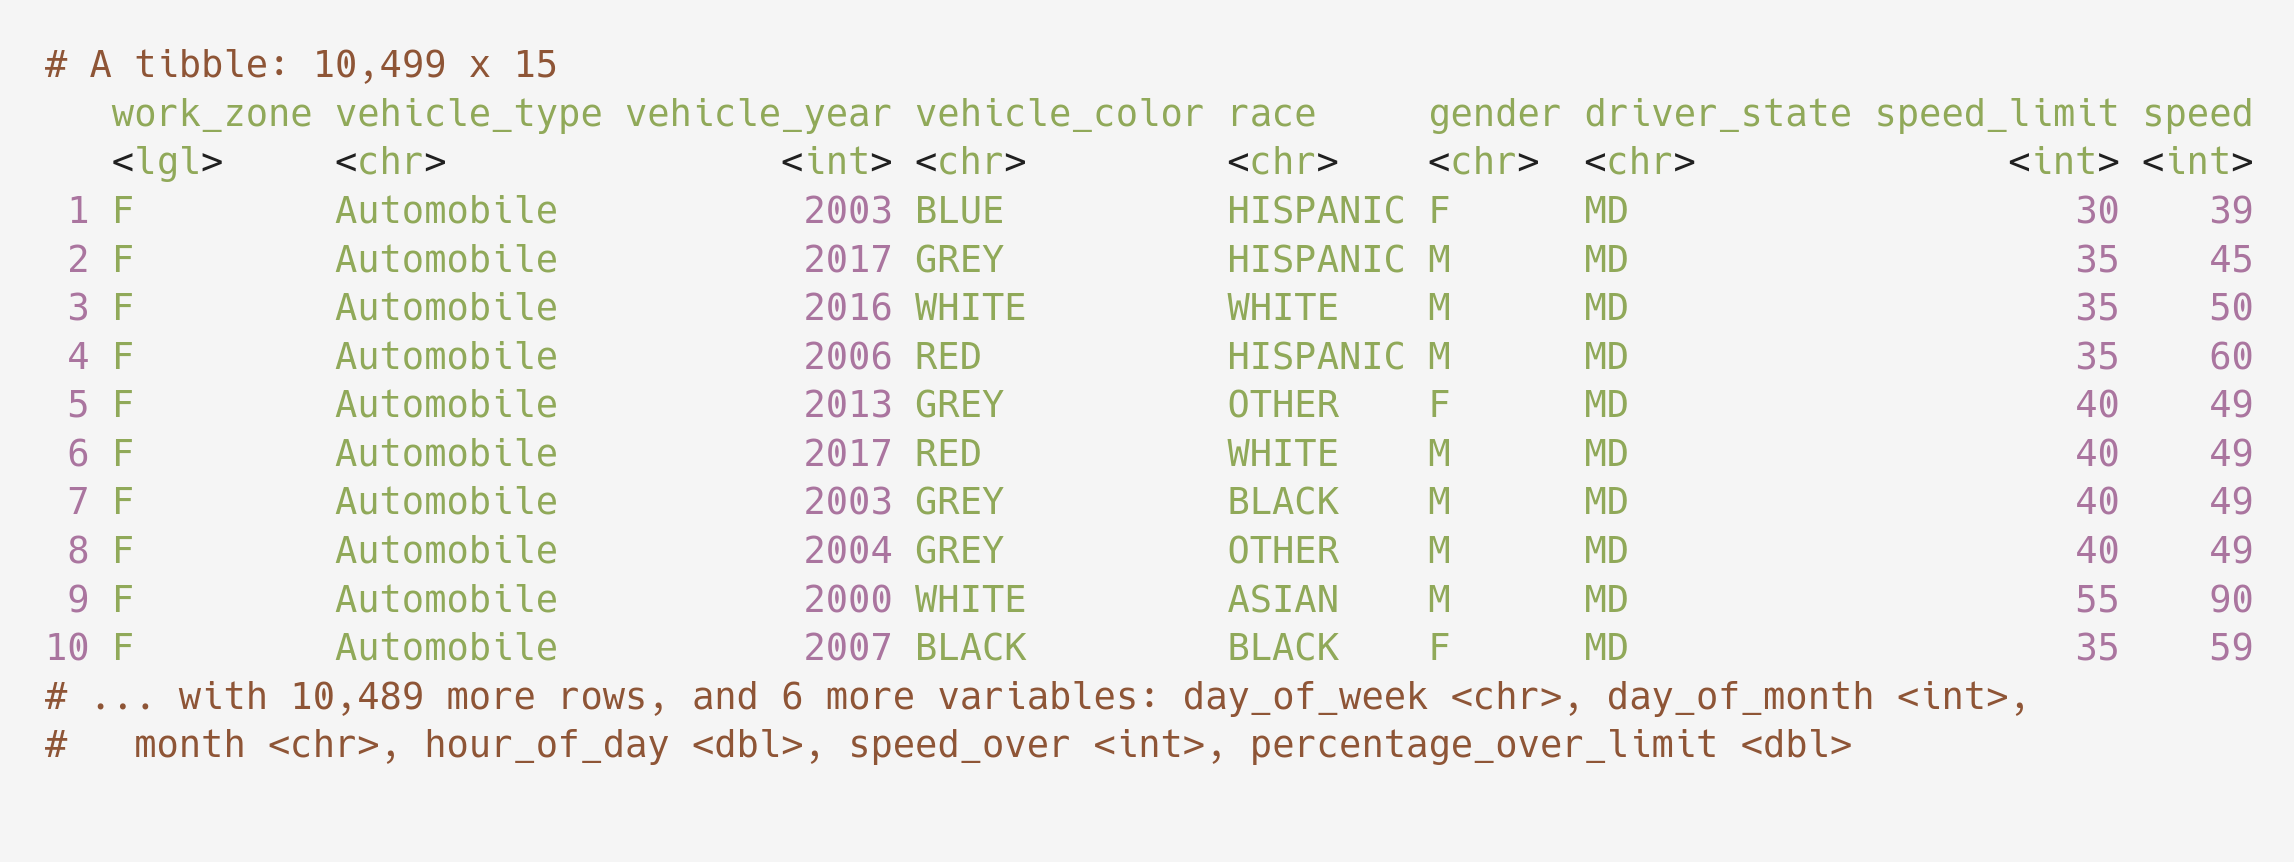
Maryland-snelheidsdata
- Snelheidsboetes in Montgomery County, Maryland in 2017
- Opgehaald van data.montgomerycountymd.gov
md_speeding