Histograms
Introduction to the Tidyverse

David Robinson
Chief Data Scientist, DataCamp
Histogram
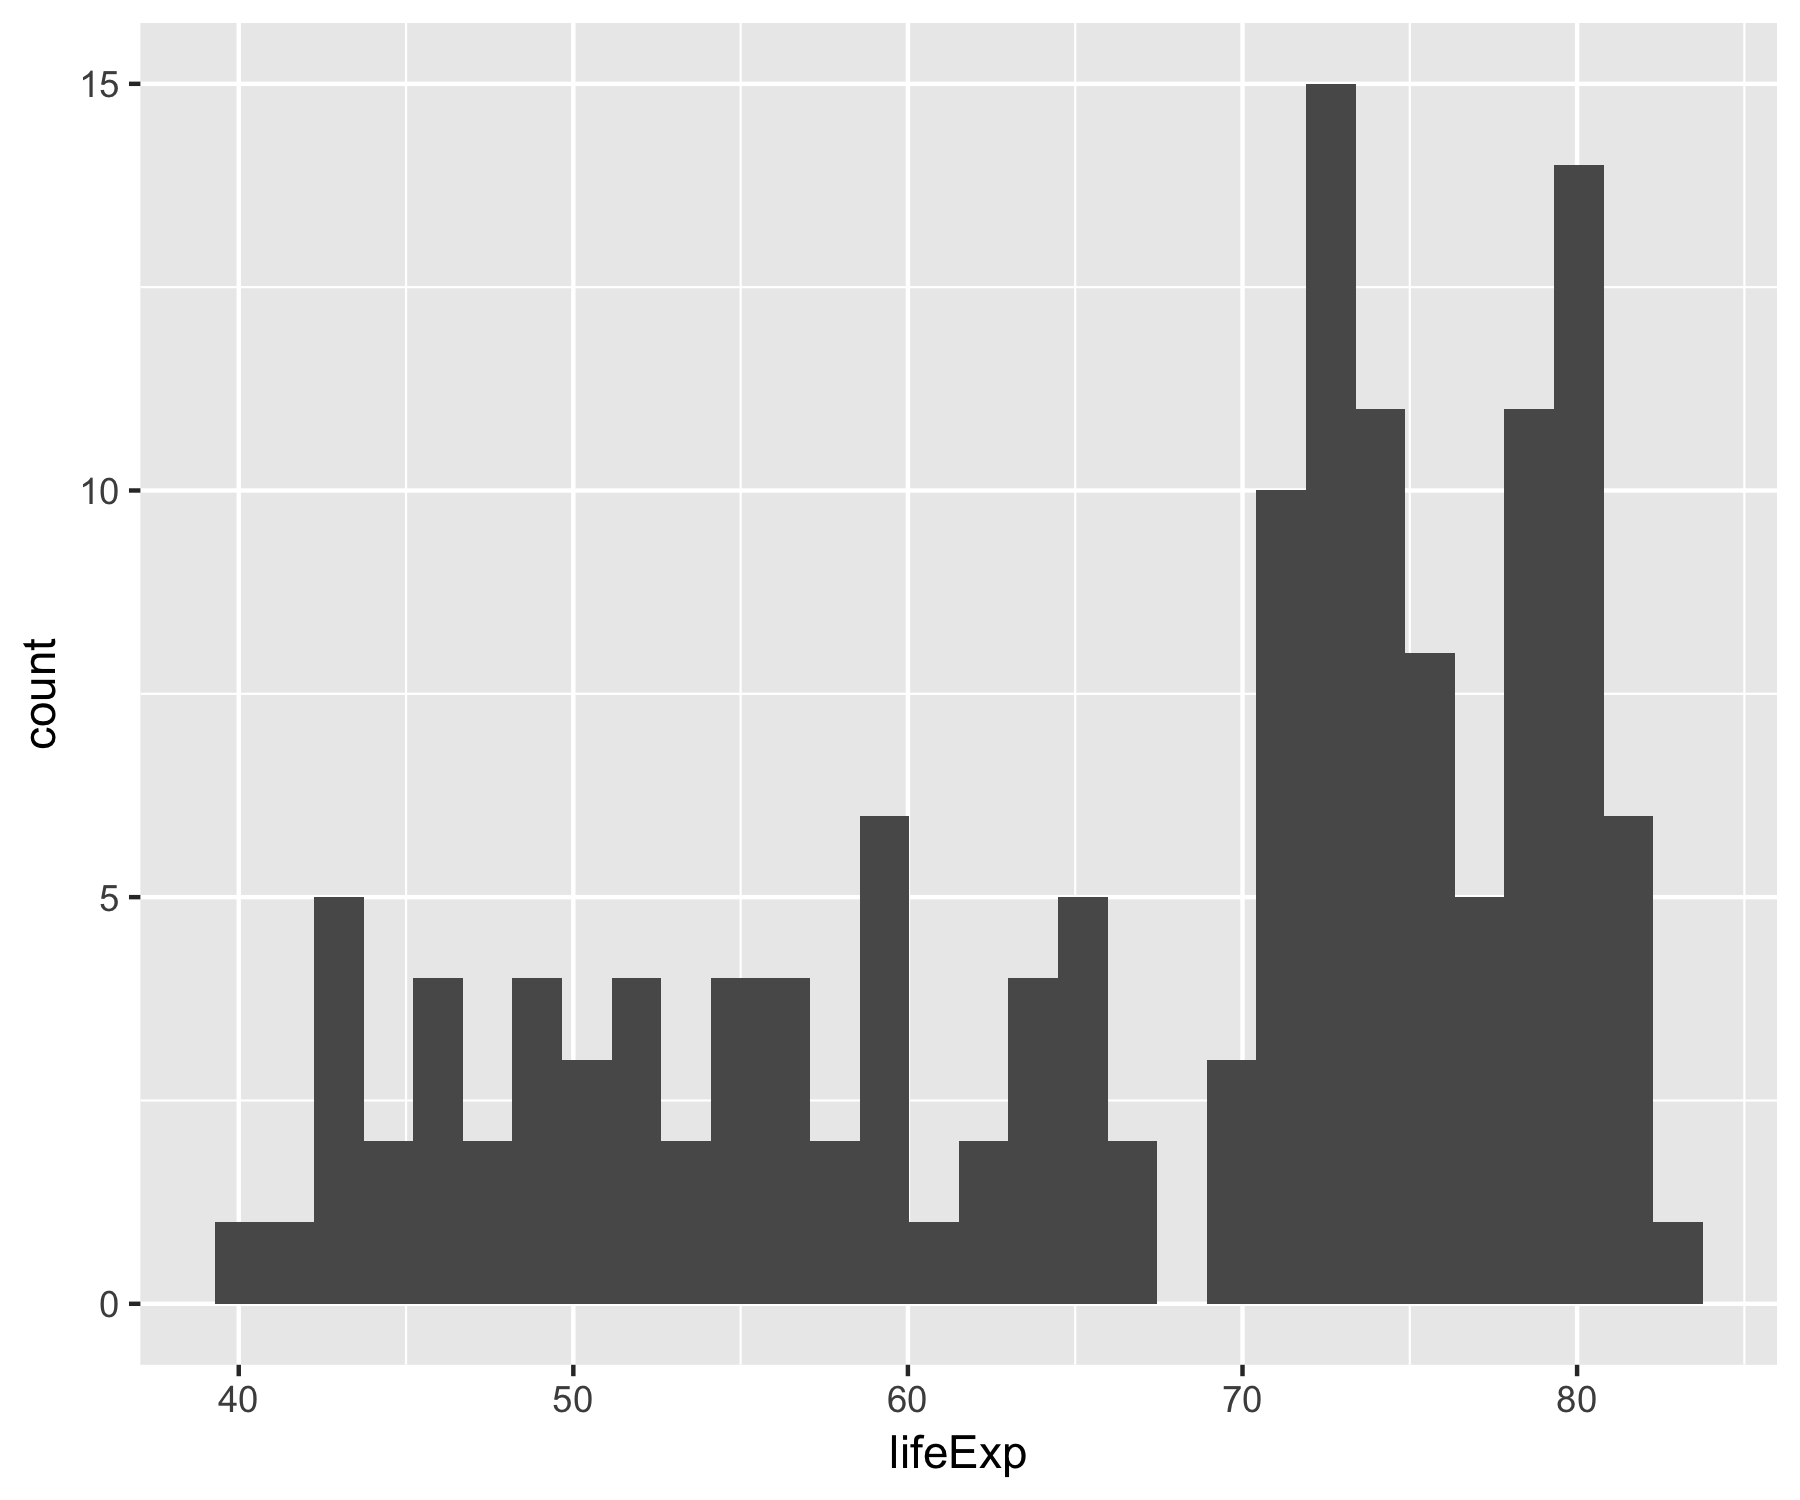
ggplot(gapminder_2007, aes(x = lifeExp)) +
  geom_histogram()
Adjusting bin width
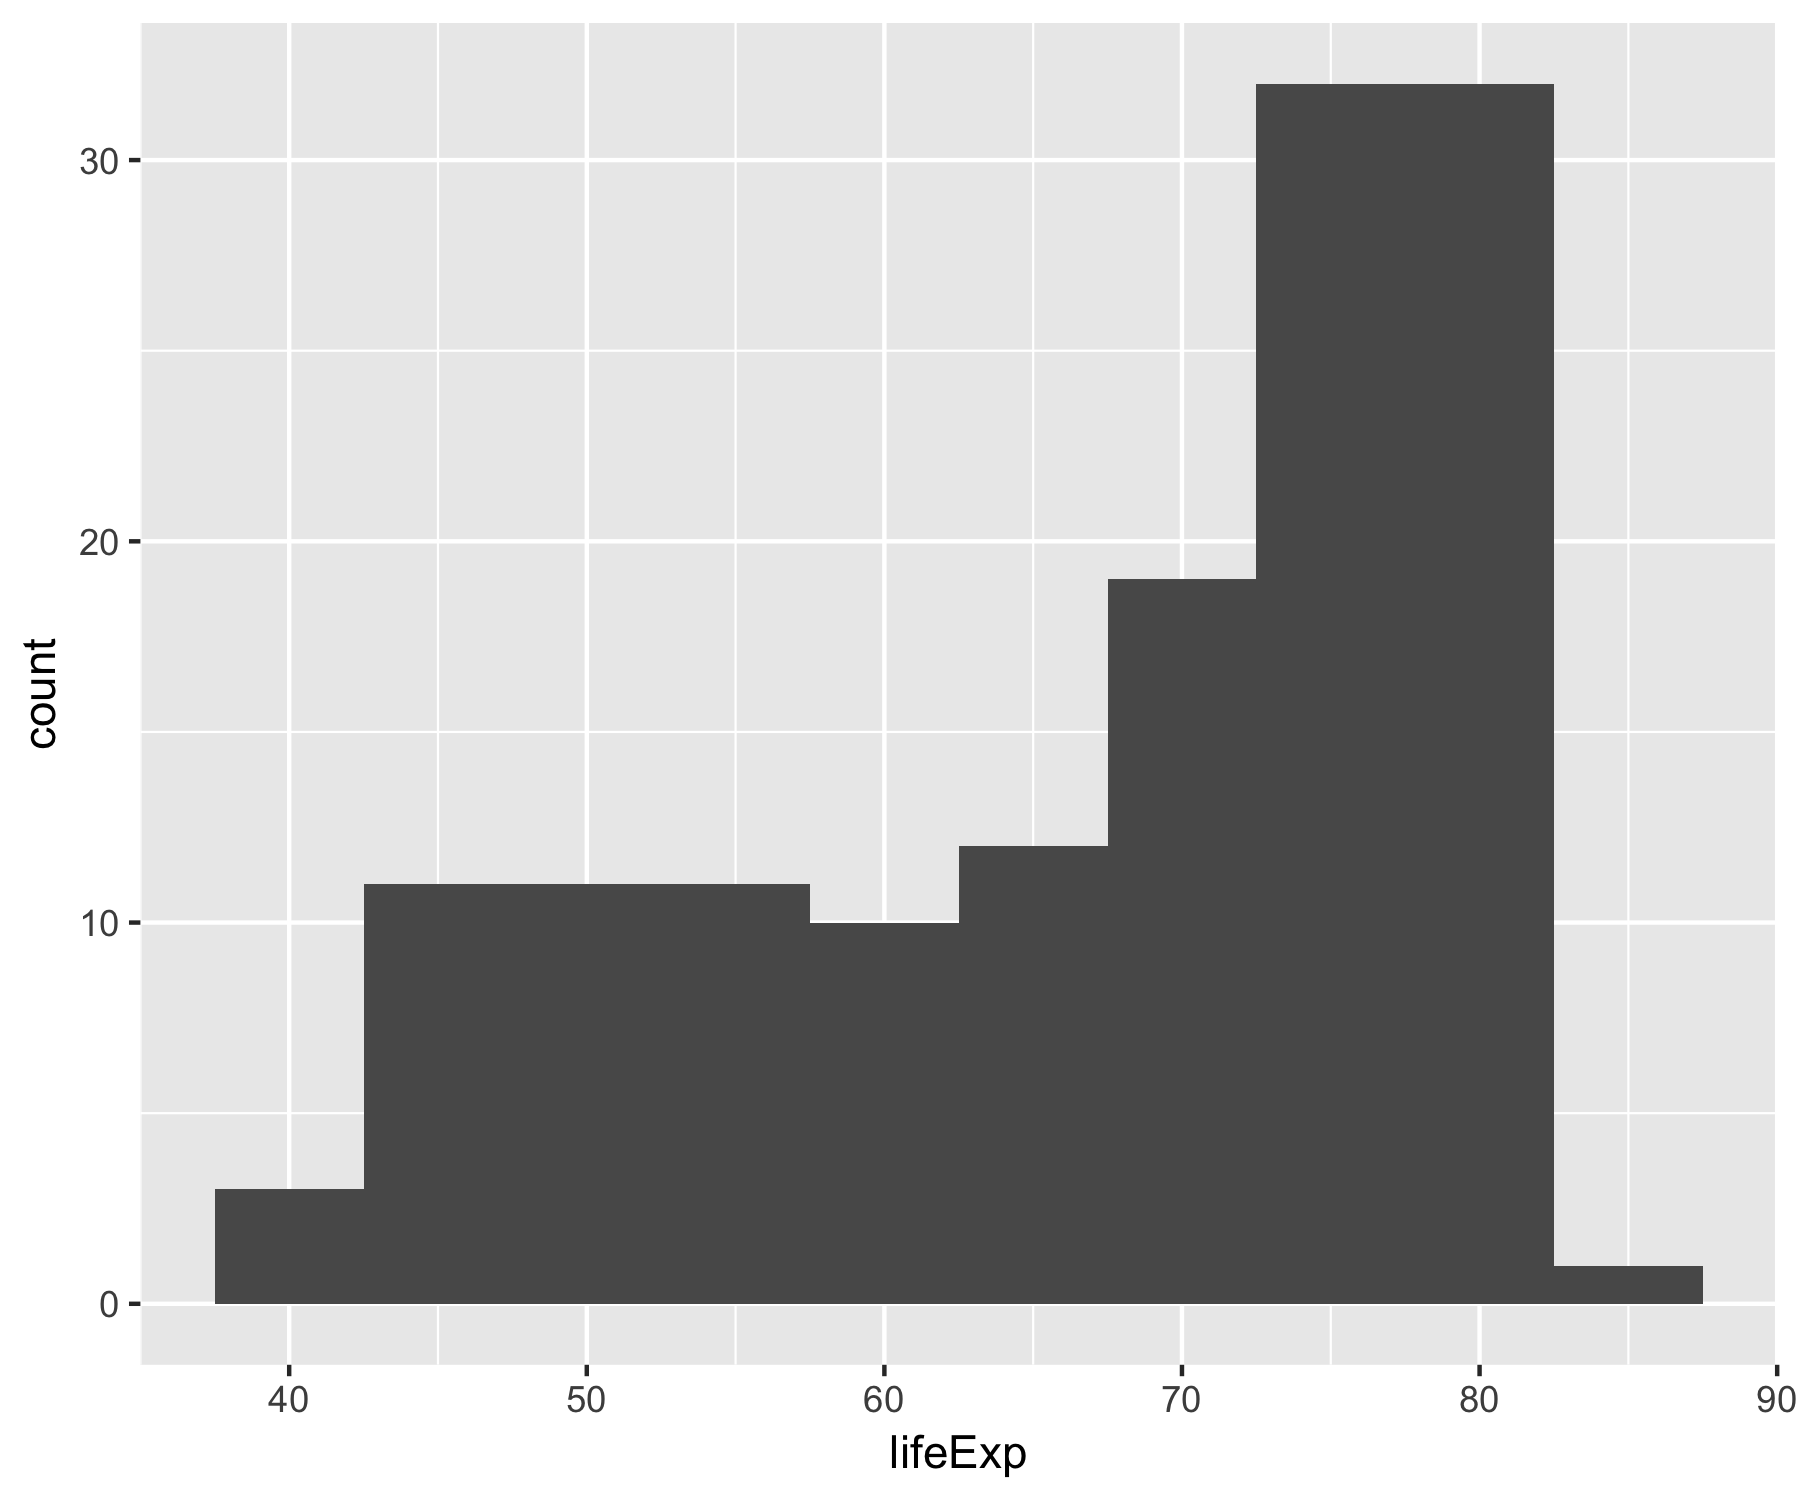
ggplot(gapminder_2007, aes(x = lifeExp)) +
  geom_histogram(binwidth = 5)

