De predictor-insightgrafiek plotten

Introductie tot Predictive Analytics in Python

Nele Verbiest, Ph.D

Data Scientist @PythonPredictions

De predictor-insightgrafiek
Introductie tot Predictive Analytics in Python

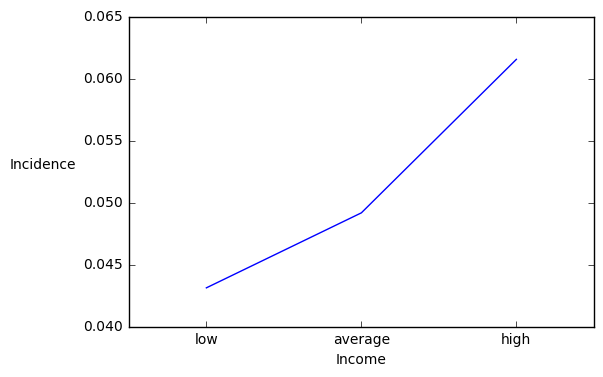
Doel-incidentie plotten

import matplotlib.pyplot as plt
import numpy as np

# Grafiek plotten pig_table["Incidence"].plot()
# Groepsnamen tonen plt.xticks(np.arange(len(pig_table)), pig_table["income"])
# Groepsnamen centreren width = 0.5 plt.xlim([-width, len(pig_table)-width])
plt.ylabel("Incidence", rotation = 0, rotation_mode="anchor", ha = "right") plt.xlabel("Income") plt.show()

Introductie tot Predictive Analytics in Python

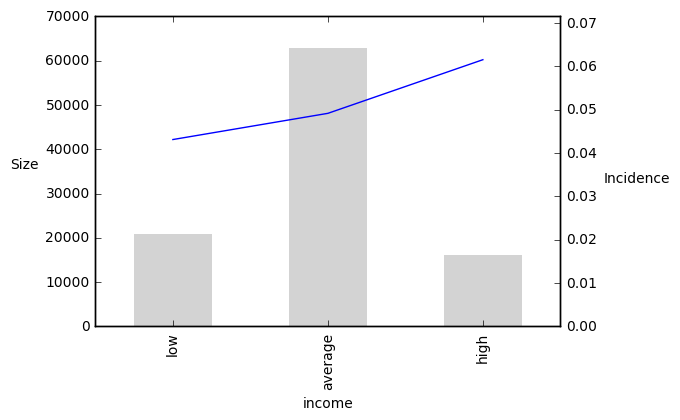
Grootten plotten

import matplotlib.pyplot as plt
import numpy as np
# Grafiek plotten

plt.ylabel("Size", rotation = 0,rotation_mode="anchor", ha = "right" )
pig_table["Incidence"].plot(secondary_y = True)
pig_table["Size"].plot(kind='bar', width = 0.5, color = "lightgray", edgecolor = "none") ## Balken toevoegen
# Groepsnamen tonen plt.xticks(np.arange(len(pig_table)), pig_table["income"]) # Groepsnamen centreren plt.xlim([-0.5, len(pt)-0.5]) plt.ylabel("Incidence", rotation = 0, rotation_mode="anchor", ha = "right" plt.xlabel("Income") plt.show()
Introductie tot Predictive Analytics in Python

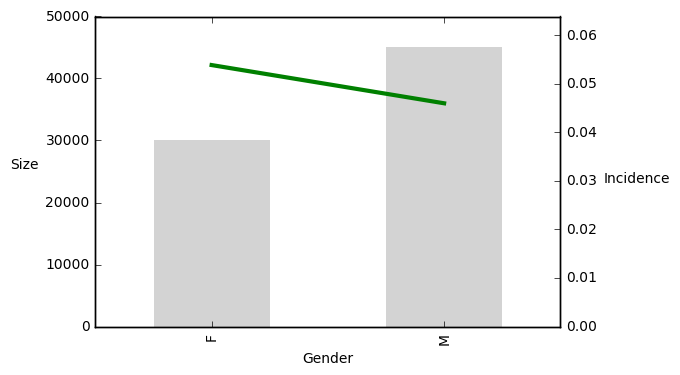
Grootten plotten

Introductie tot Predictive Analytics in Python

Laten we oefenen!

Introductie tot Predictive Analytics in Python

Preparing Video For Download...