Inzichtgrafieken voor voorspellers

Introductie tot Predictive Analytics in Python

Nele Verbiest, Ph.D

Data Scientist @PythonPredictions

Motivatie voor inzichtgrafieken voor voorspellers

  1. Bouw model
  2. Evalueer model met AUC
  3. Evalueer model met cumulatieve winst- en liftcurves
  4. Controleer of de variabelen in het model interpreteerbaar zijn
Introductie tot Predictive Analytics in Python

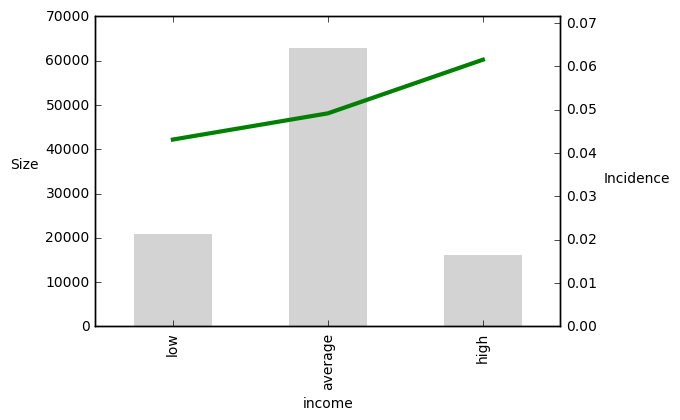
Interpretatie van inzichtgrafieken voor voorspellers
Introductie tot Predictive Analytics in Python

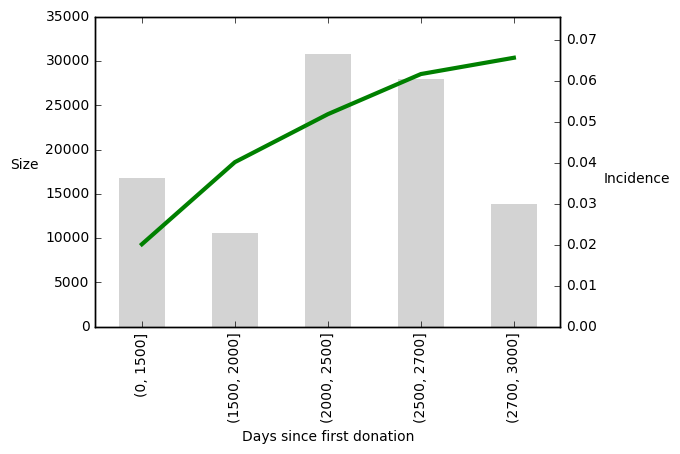
Inzichtgrafieken voor continue variabelen
Introductie tot Predictive Analytics in Python

De tabel van de inzichtgrafiek voor voorspellers

Income Size Incidence
low 20850 0.0431
average 62950 0.0492
high 16200 0.0615


print(pig_table["Size"][income=="low"])
20850
Introductie tot Predictive Analytics in Python

Een inzichtgrafiek voor voorspellers maken

  • (Discretisatie van variabele als deze continu is)
  • Bereken de tabel voor de inzichtgrafiek
  • Plot de inzichtgrafiek
Introductie tot Predictive Analytics in Python

Laten we oefenen!

Introductie tot Predictive Analytics in Python

Preparing Video For Download...