Voorspellingen maken
Bayesian Data Analysis in Python

Michal Oleszak
Machine Learning Engineer
Hoe goed is de voorspelling?
   clothes_banners_shown  sneakers_banners_shown  num_clicks  weekend
0                     40                      36           7     True
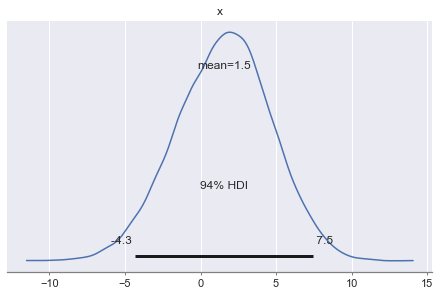
pm.plot_posterior(posterior_predictive["y"][:, 0])
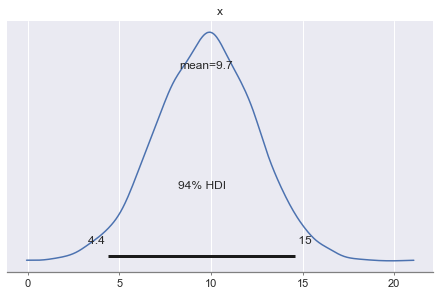
Foutverdeling (test)