Lineaire relaties kwantificeren

Introductie tot lineaire modellering in Python

Jason Vestuto

Data Scientist

Voor-visualisatie
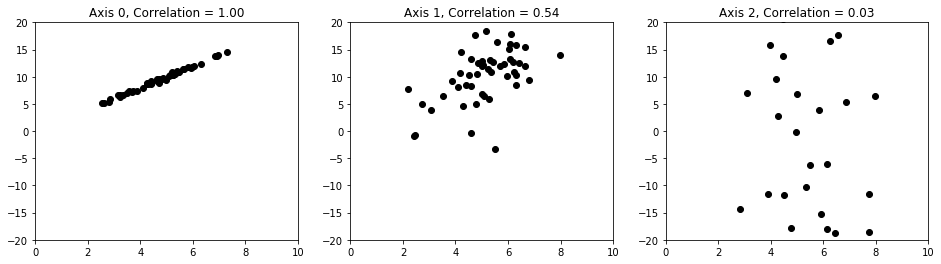
3-panel figuur, 3 spreidingsdiagrammen, van sterke naar nulcorrelatie, van links naar rechts

Introductie tot lineaire modellering in Python

Herhaling: statistiek met één variabele

# Mean
mean = sum(x)/len(x)
# Deviation, sometimes called "centering"
dx = x - np.mean(x)
# Variance
variance = np.mean(dx*dx)
# Standard Deviation
stdev = np.sqrt(variance)
Introductie tot lineaire modellering in Python

Covariantie

# Deviations of two variables
dx = x - np.mean(x)
dy = y - np.mean(y)
# Co-vary means to vary together
deviation_products = dx*dy
# Covariance as the mean
covariance = np.mean(dx*dy)
Introductie tot lineaire modellering in Python

Correlatie

# Divide deviations by standard deviation 
zx = dx/np.std(x)
zy = dy/np.std(y)
# Mean of the normalize deviations
correlation = np.mean(zx*zy)
Introductie tot lineaire modellering in Python

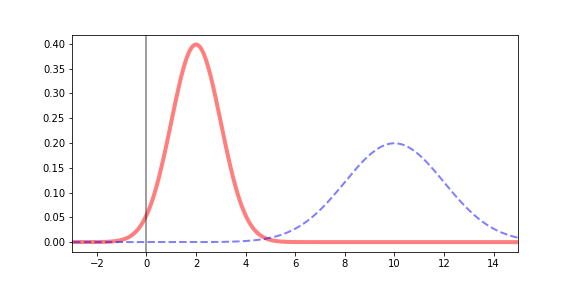
Normaliseren: vóór

Plot van gaussische verdelingen, klokvormig, met verschillende middelpunten, hoogtes en breedtes

Introductie tot lineaire modellering in Python

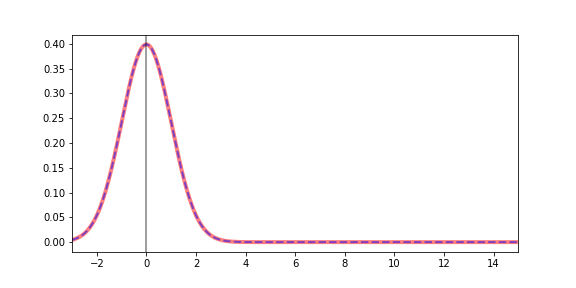
Normaliseren: na

Plot van gaussische verdelingen, klokvormig, beide gecentreerd op nul, met gelijke hoogte en breedte

Introductie tot lineaire modellering in Python

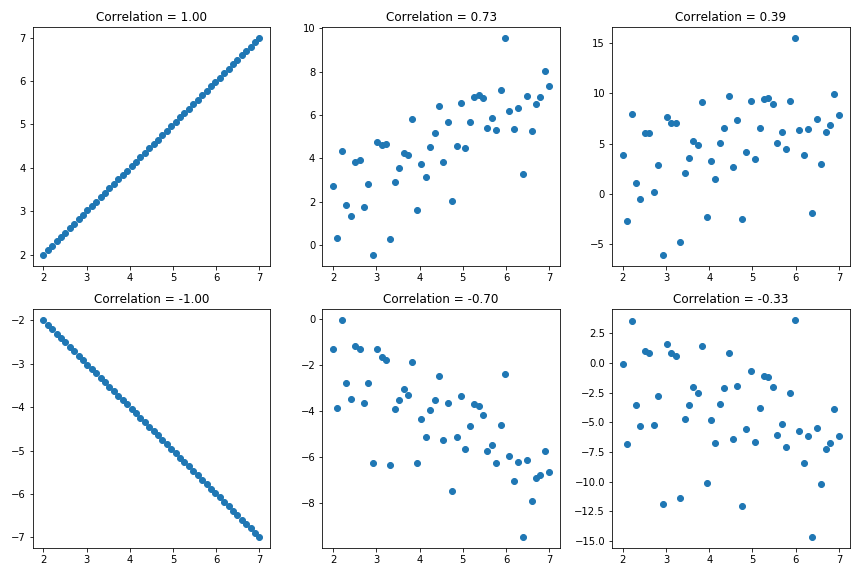
Grootte versus richting

  • Correlatiewaarden: -1 tot +1

6-panel figuur, 2 rijen van 3 kolommen, spreidingsdiagrammen, van sterkere naar zwakkere correlatie van links naar rechts

  • Twee onderdelen: grootte (1 tot 0) versus teken (+ of -)
Introductie tot lineaire modellering in Python

Laten we oefenen!

Introductie tot lineaire modellering in Python

Preparing Video For Download...