Lineaire relaties visualiseren

Introductie tot lineaire modellering in Python

Jason Vestuto

Data Scientist

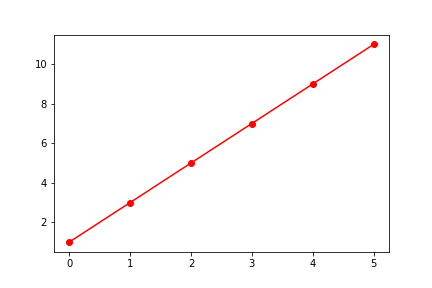
Snel plotten

import matplotlib.pyplot as plt
plt.plot(x, y, 'r-o')
plt.show()
Introductie tot lineaire modellering in Python

Objectinterface

# Importeer de module pyplot
import matplotlib.pyplot as plt
# Maak figure- en as-objecten
fig, axis = plt.subplots()
# Voorbereiden van beginstijlen
options = dict(marker='o', color='blue')
Introductie tot lineaire modellering in Python

Objectinterface

# Roep de plot-methode aan op het as-object
line = axis.plot(x, y, **options)
# Pas het as-object aan met set-methodes
_ = axis.set_ylabel('Times')
_ = axis.set_xlabel('Distances')
# Figuur tonen
plt.show()
Introductie tot lineaire modellering in Python

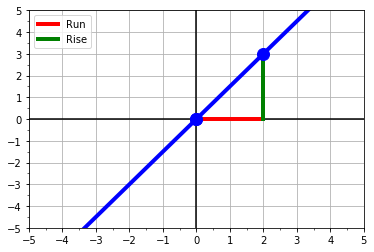
Lineaire data visualiseren

  • twee punten:
    • (x1,y1) = (0,0)
    • (x2,y2) = (2,3)
  • verandering in x en y:
    • dy = (y2 - y1) = 3 - 0
    • dx = (x2 - x1) = 2 - 0
  • helling = stijging/daling over run
    • slope = dy/dx = 3/2
  • intercept:
    • als x=0: y1 = 0

Plot die rise over run illustreert, toont de helling

Introductie tot lineaire modellering in Python

Laten we oefenen!

Introductie tot lineaire modellering in Python

Preparing Video For Download...