Explaining house price with size & condition
Modelleren met data in de Tidyverse

Albert Y. Kim
Assistant Professor of Statistical and Data Sciences
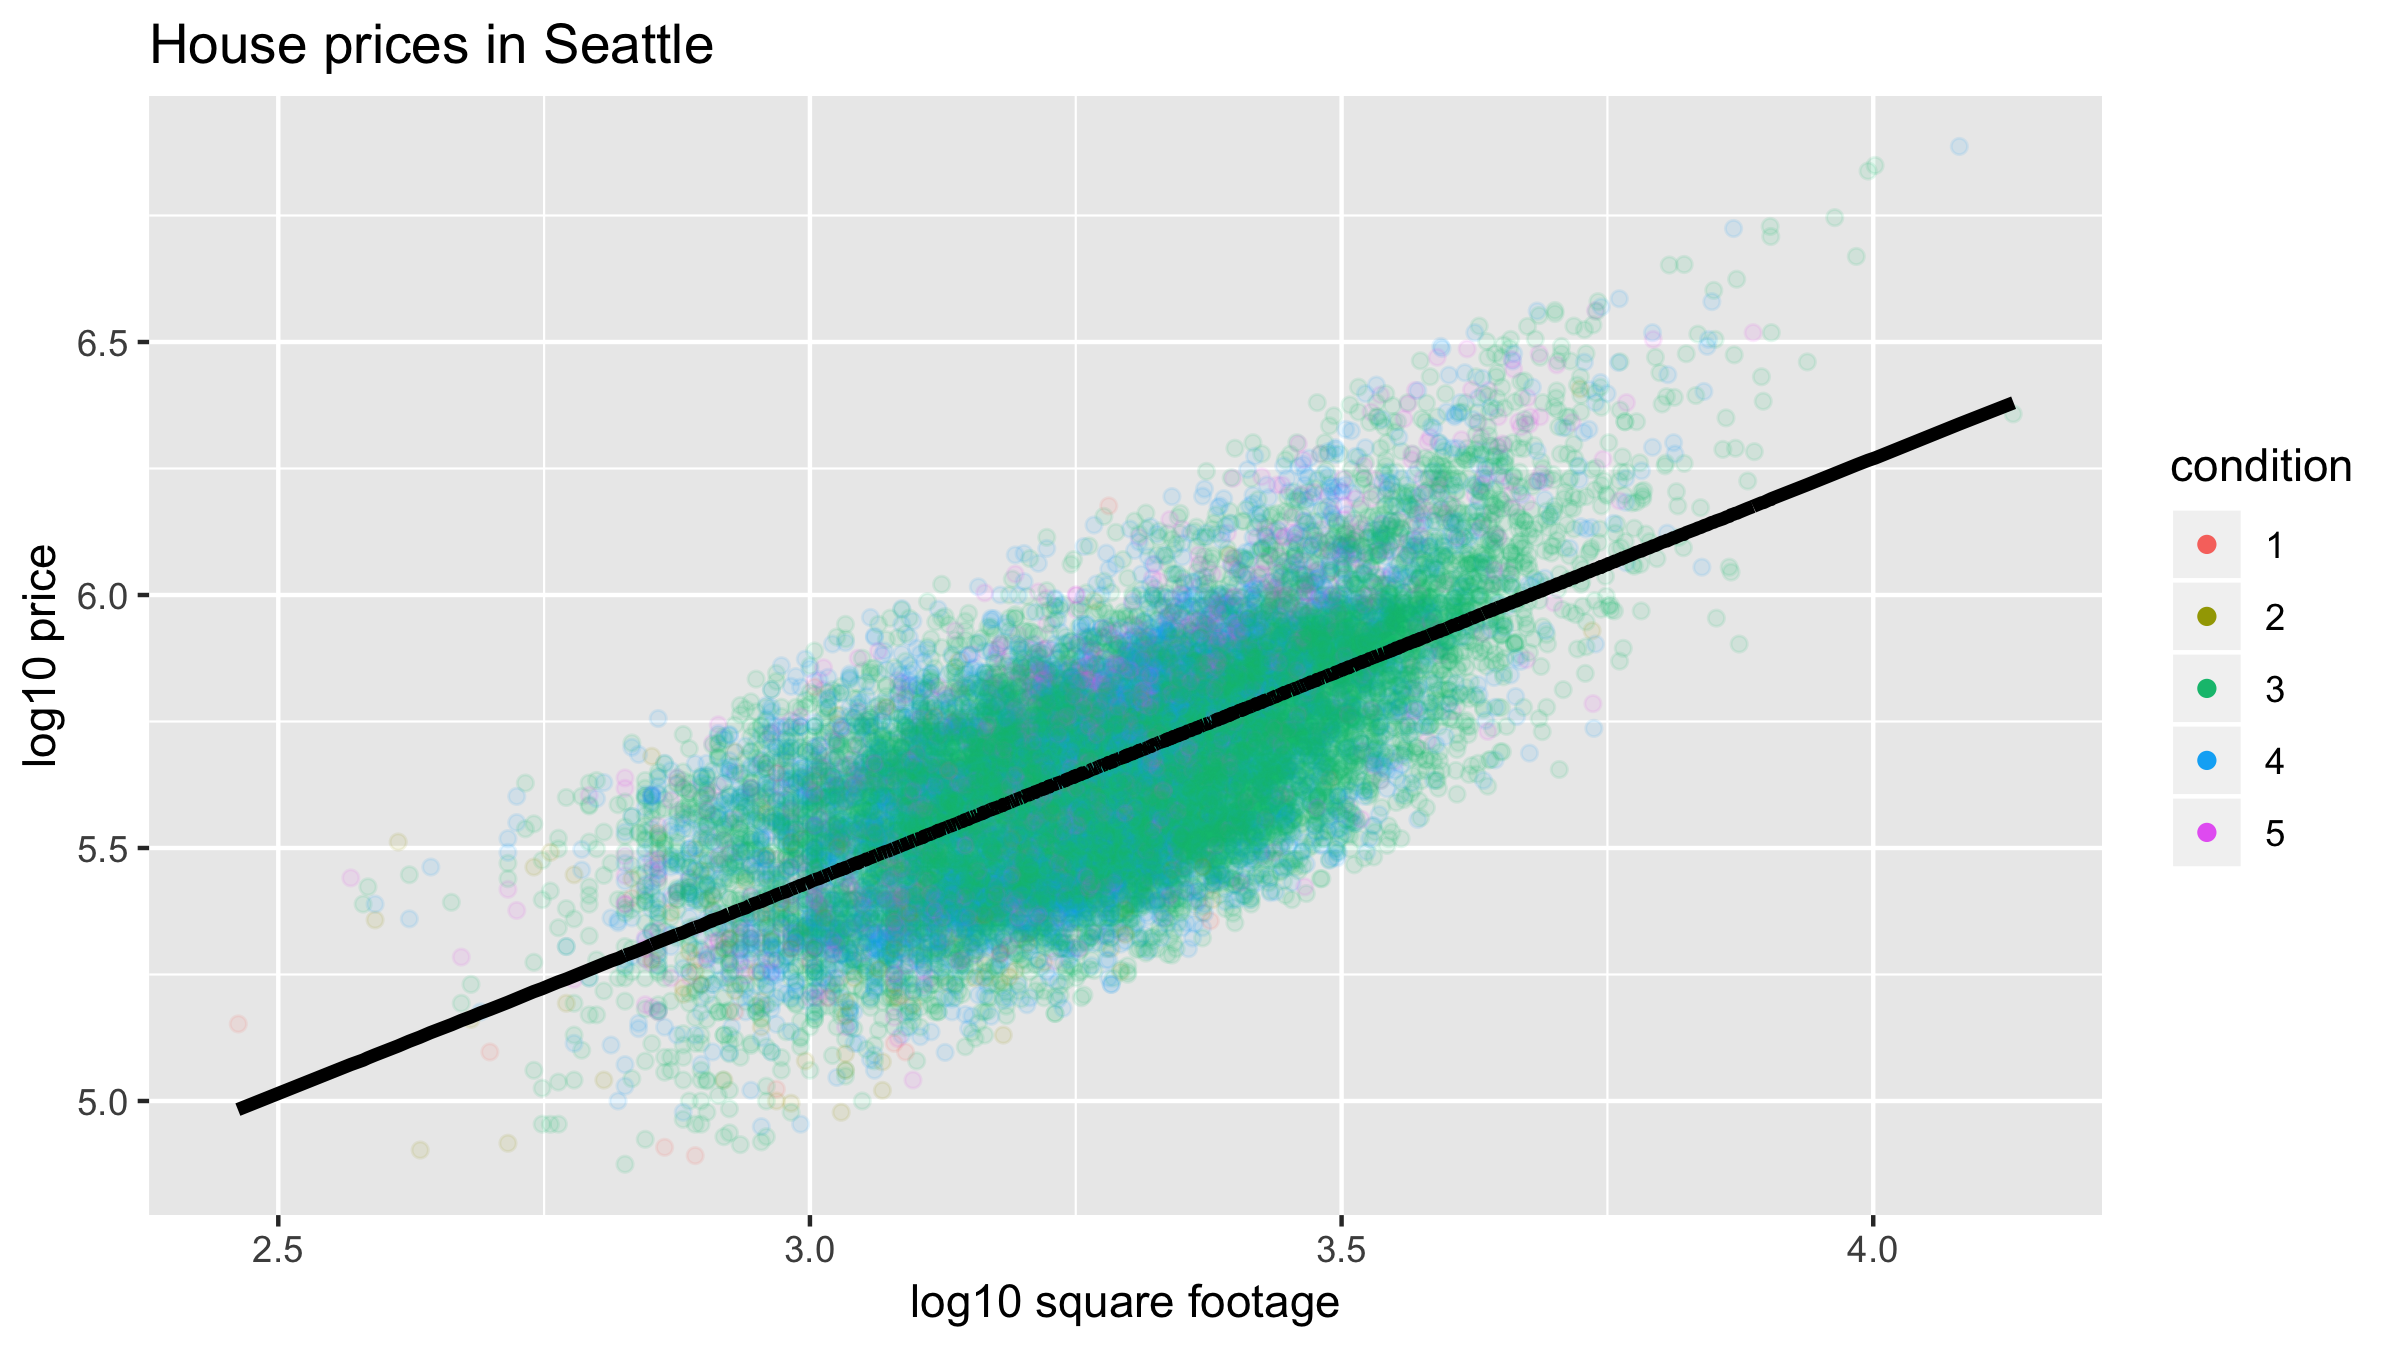
House price, size, and condition
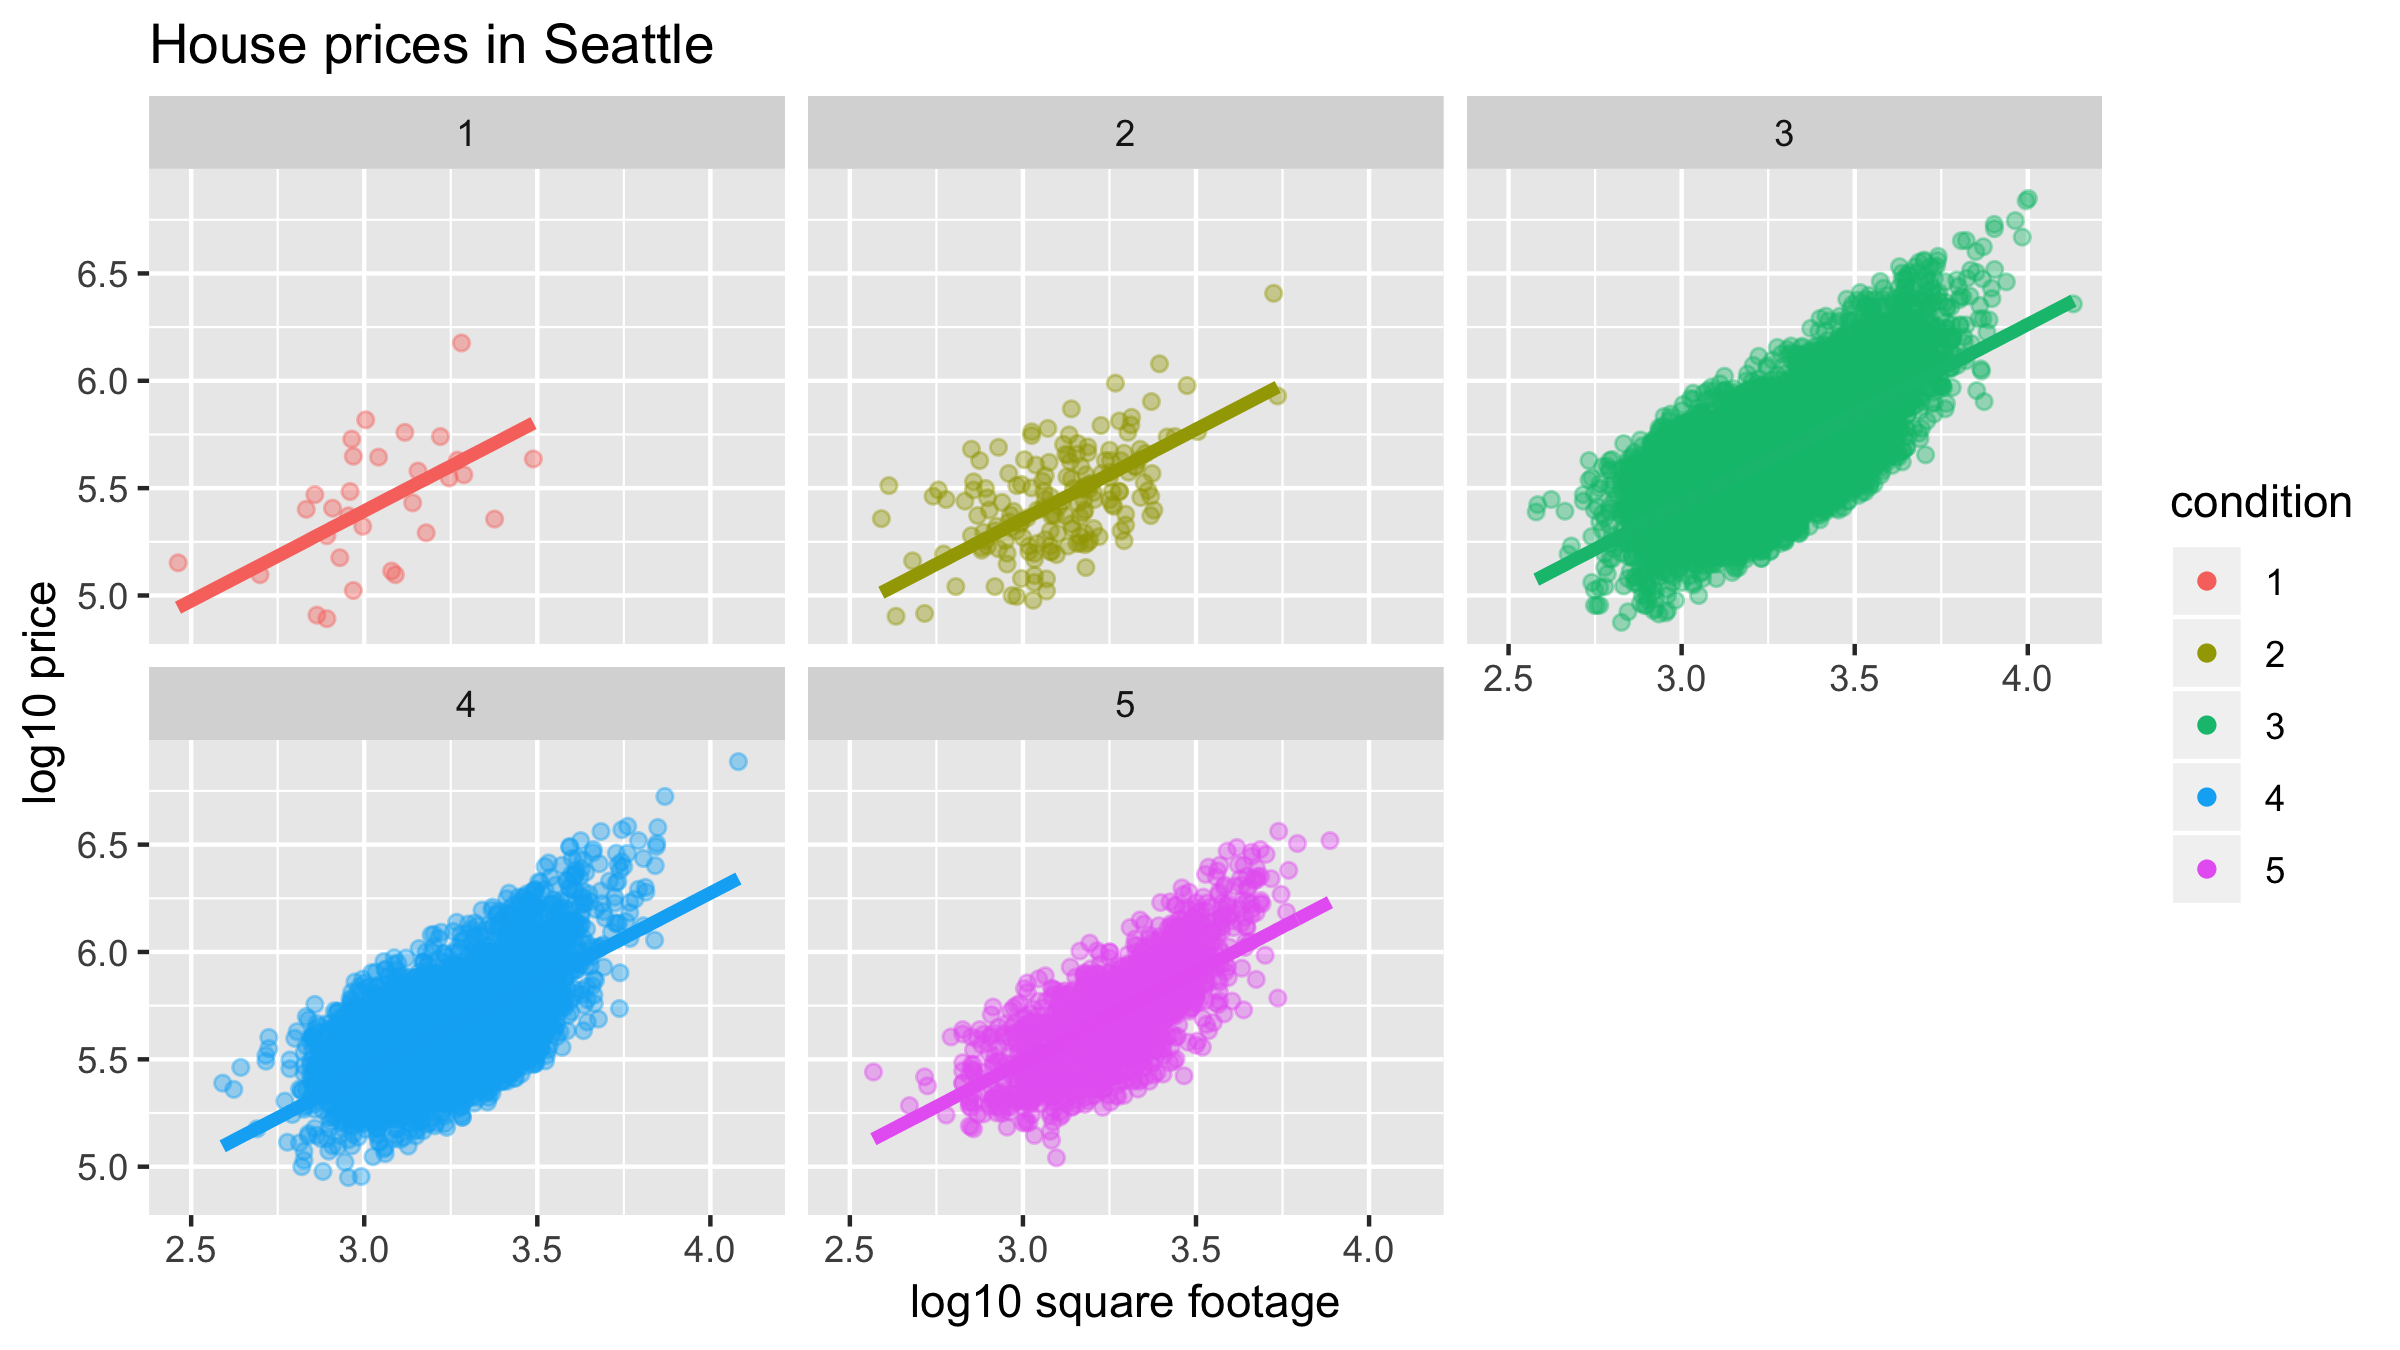
Parallel slopes model
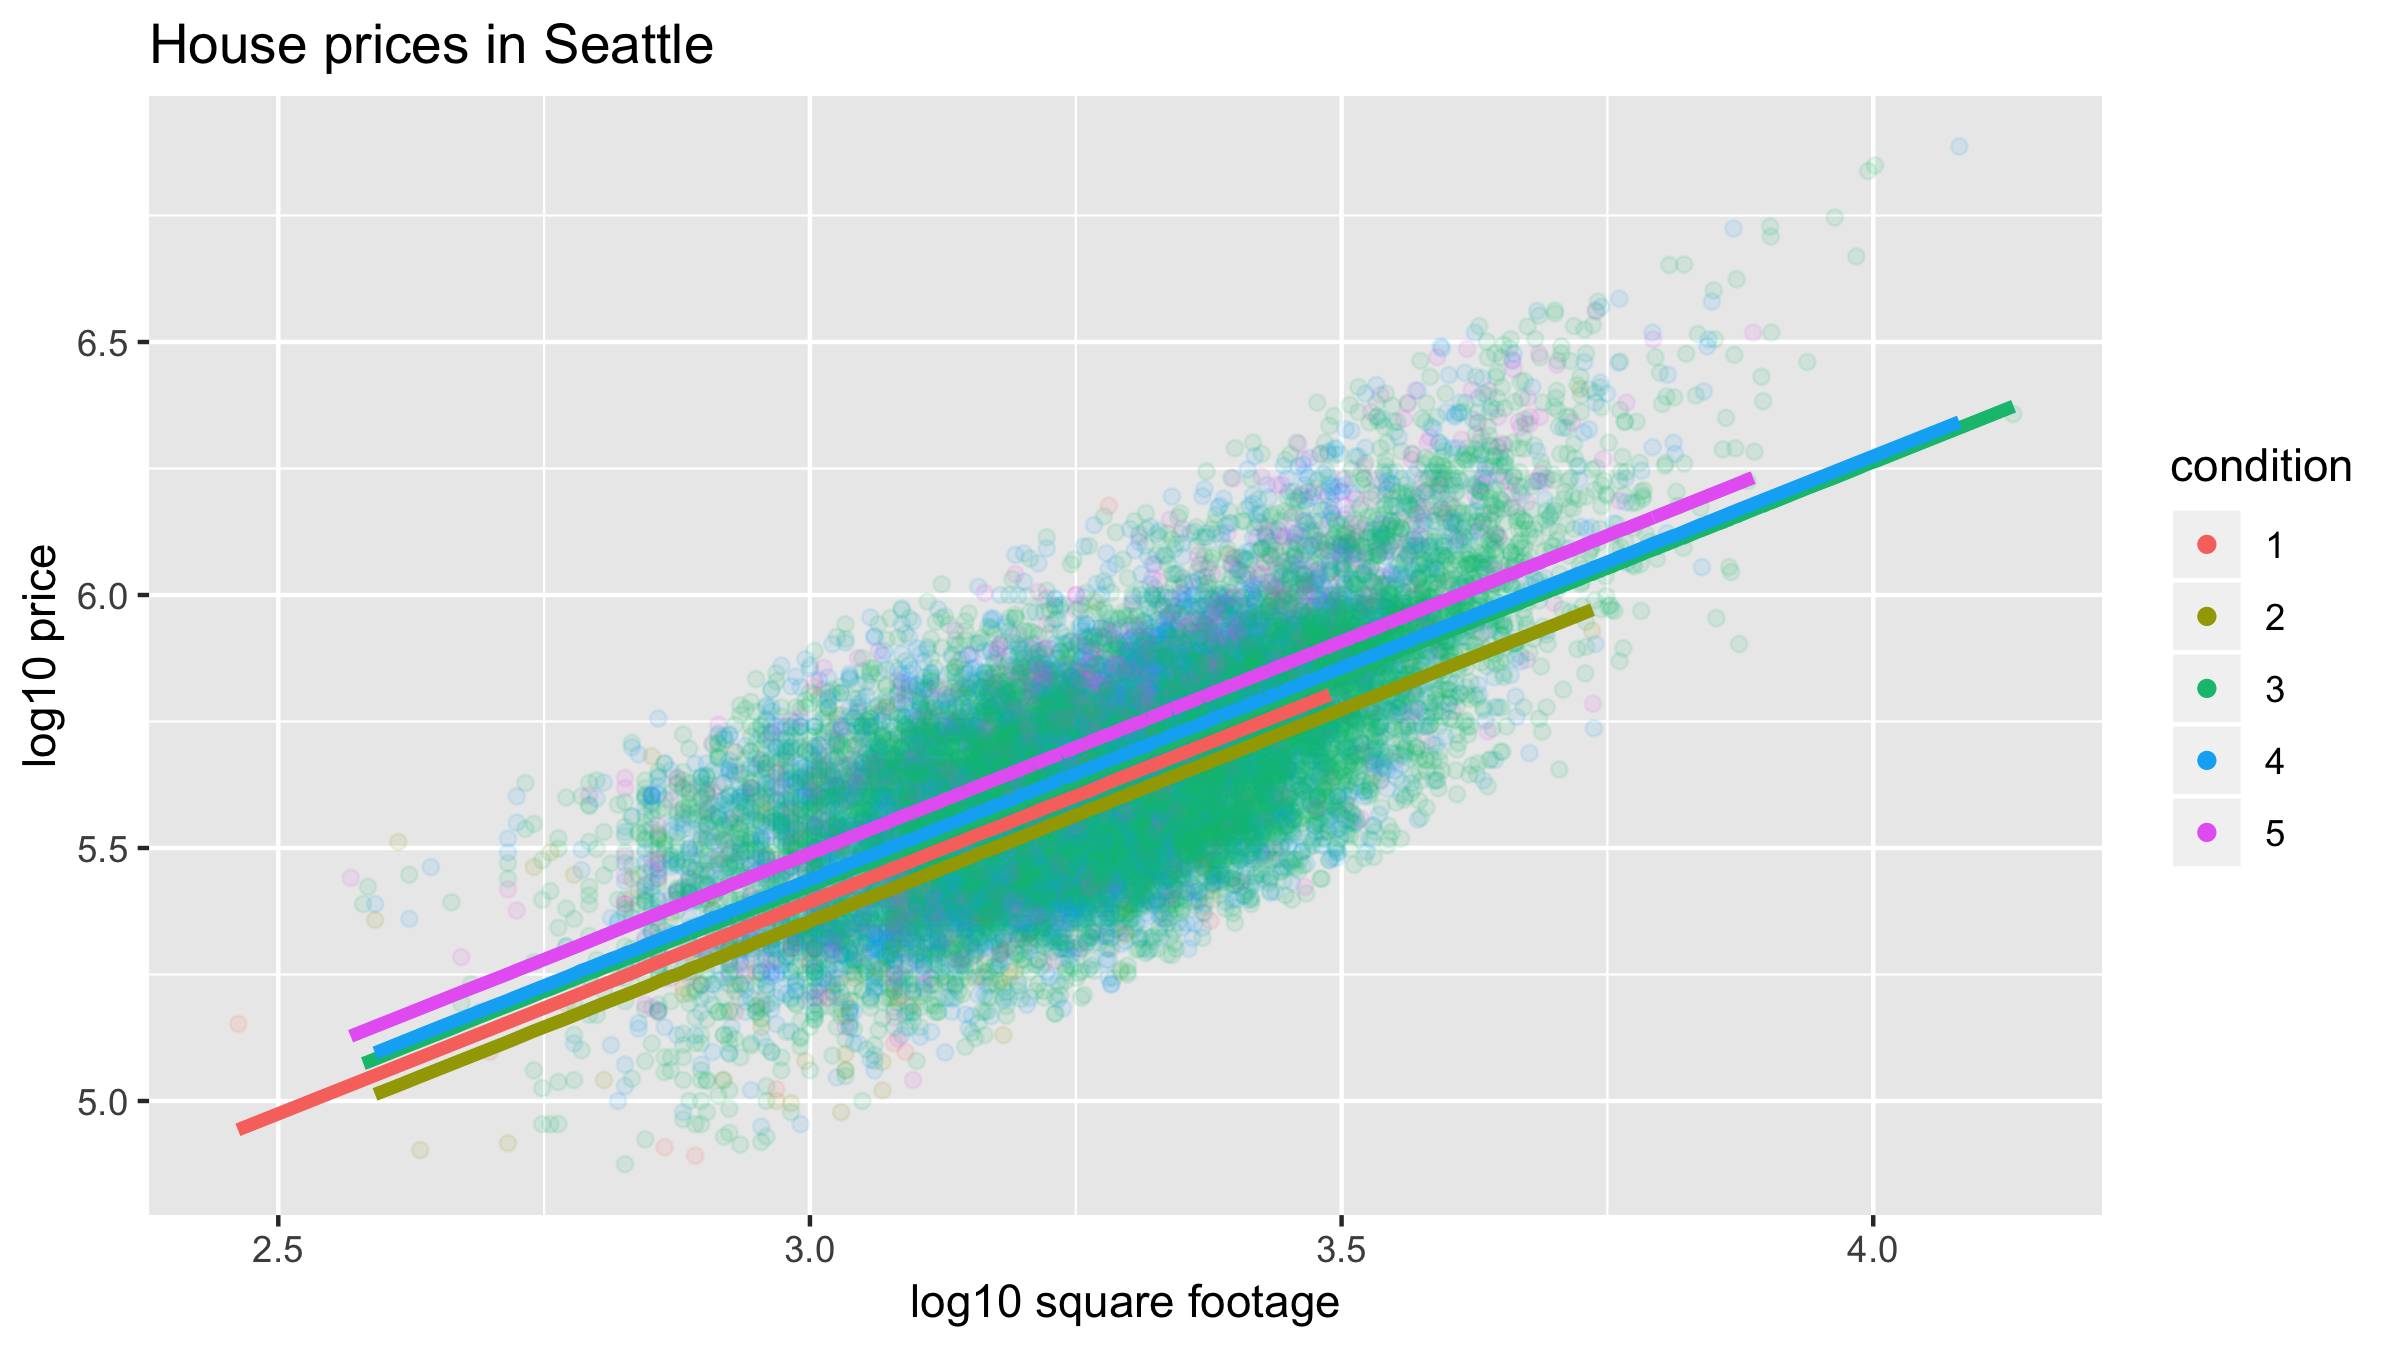
Parallel slopes model
Modelleren met data in de Tidyverse
Albert Y. Kim
Assistant Professor of Statistical and Data Sciences

