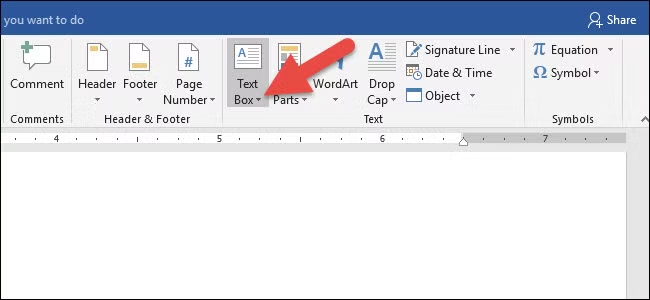
Annotaties toevoegen
Introductie tot datavisualisatie met Plotly in Python

Alex Scriven
Data Scientist
Wat zijn annotaties?
- Extra tekst- en datavakken aan een plot
$$
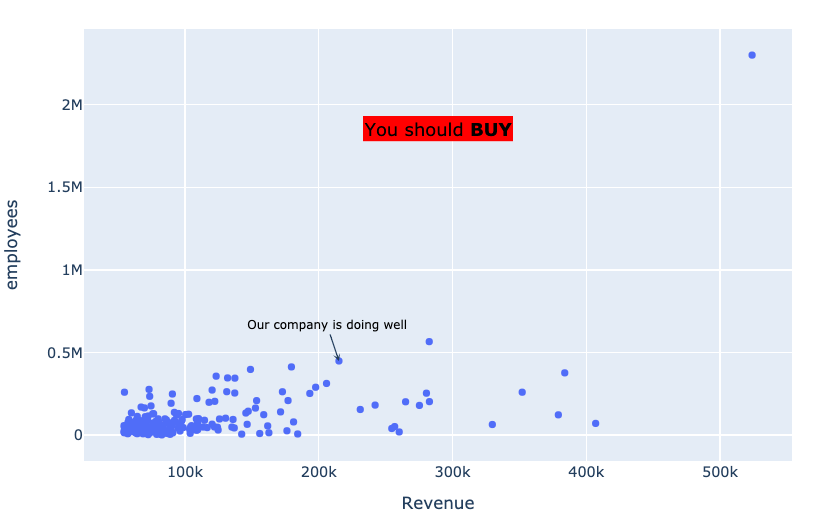
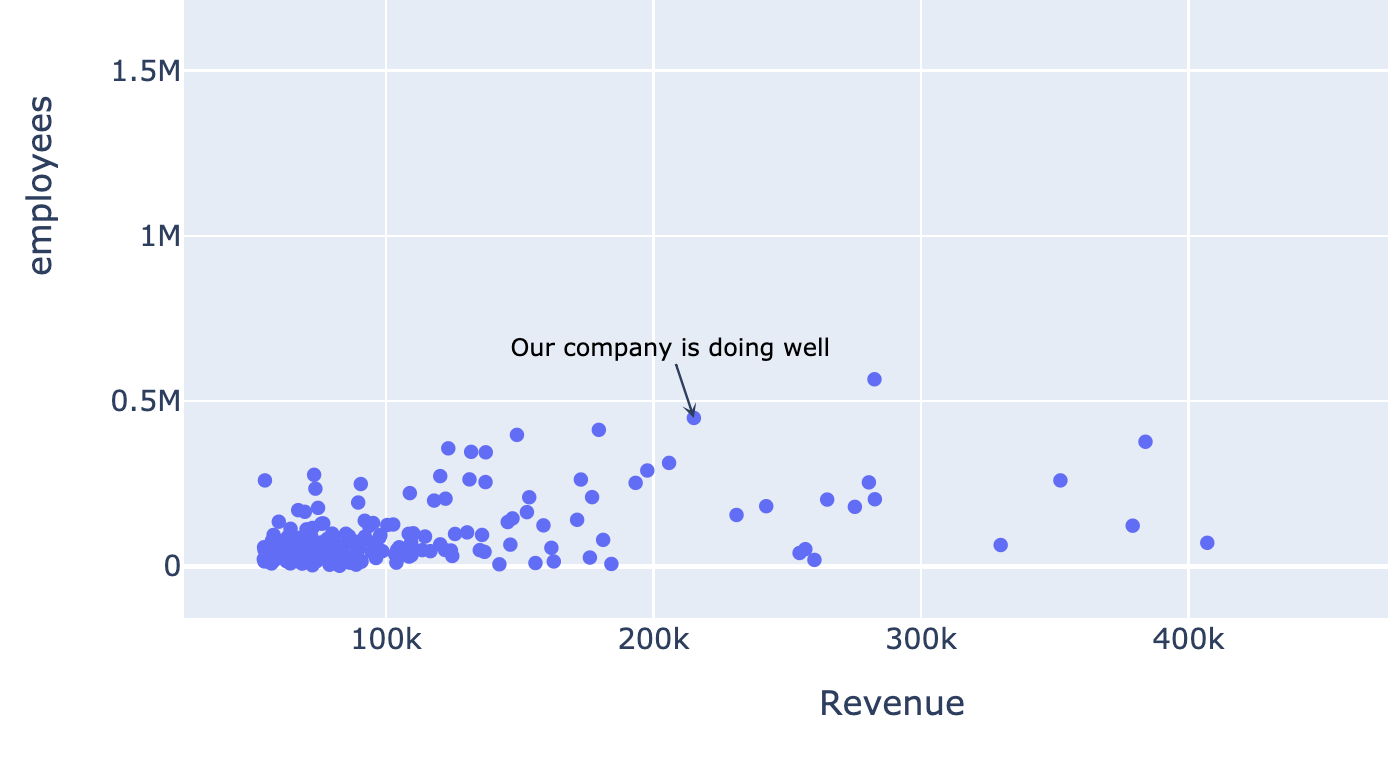
- Richt de aandacht op een datapunt
- Voeg extra notities toe aan een plot
Data-gekoppelde annotaties
$$
Zwevende annotatie