Aangepaste knoppen
Introductie tot datavisualisatie met Plotly in Python

Alex Scriven
Data Scientist
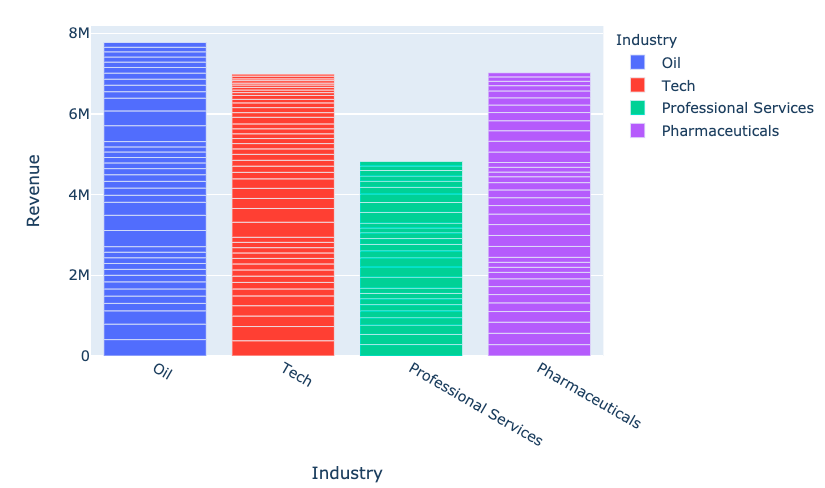
Plottype met knoppen
Het args-argument
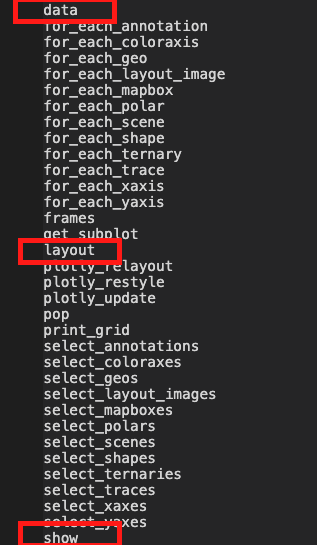
Args gebruiken voor layout-updates
dir(fig.layout)
- Werk elk argument bij met 'args'
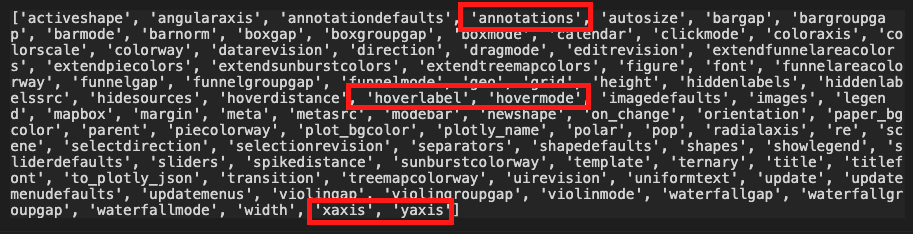
Args gebruiken voor data-updates
dir(fig.data[0])
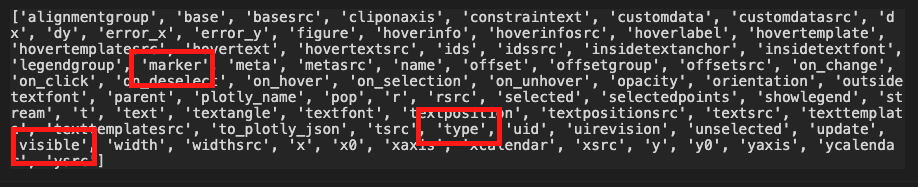
- Sommige herken je, andere zijn later handig
Knopinteractie
$$