Dynamische harmonische regressie
Voorspellen in R

Rob J. Hyndman
Professor of Statistics at Monash University
Dynamische harmonische regressie

Dynamische harmonische regressie

$m =$ seizoensperiode
Elke periodieke functie is te benaderen met sommen van sin- en cos-termen bij voldoende grote K
Regressiecoëfficiënten: $\alpha_k$ en $\gamma_k$
$e_t$ kan worden gemodelleerd als een niet-seizoensgebonden ARIMA-proces
Veronderstelt een onveranderlijk seizoenspatroon
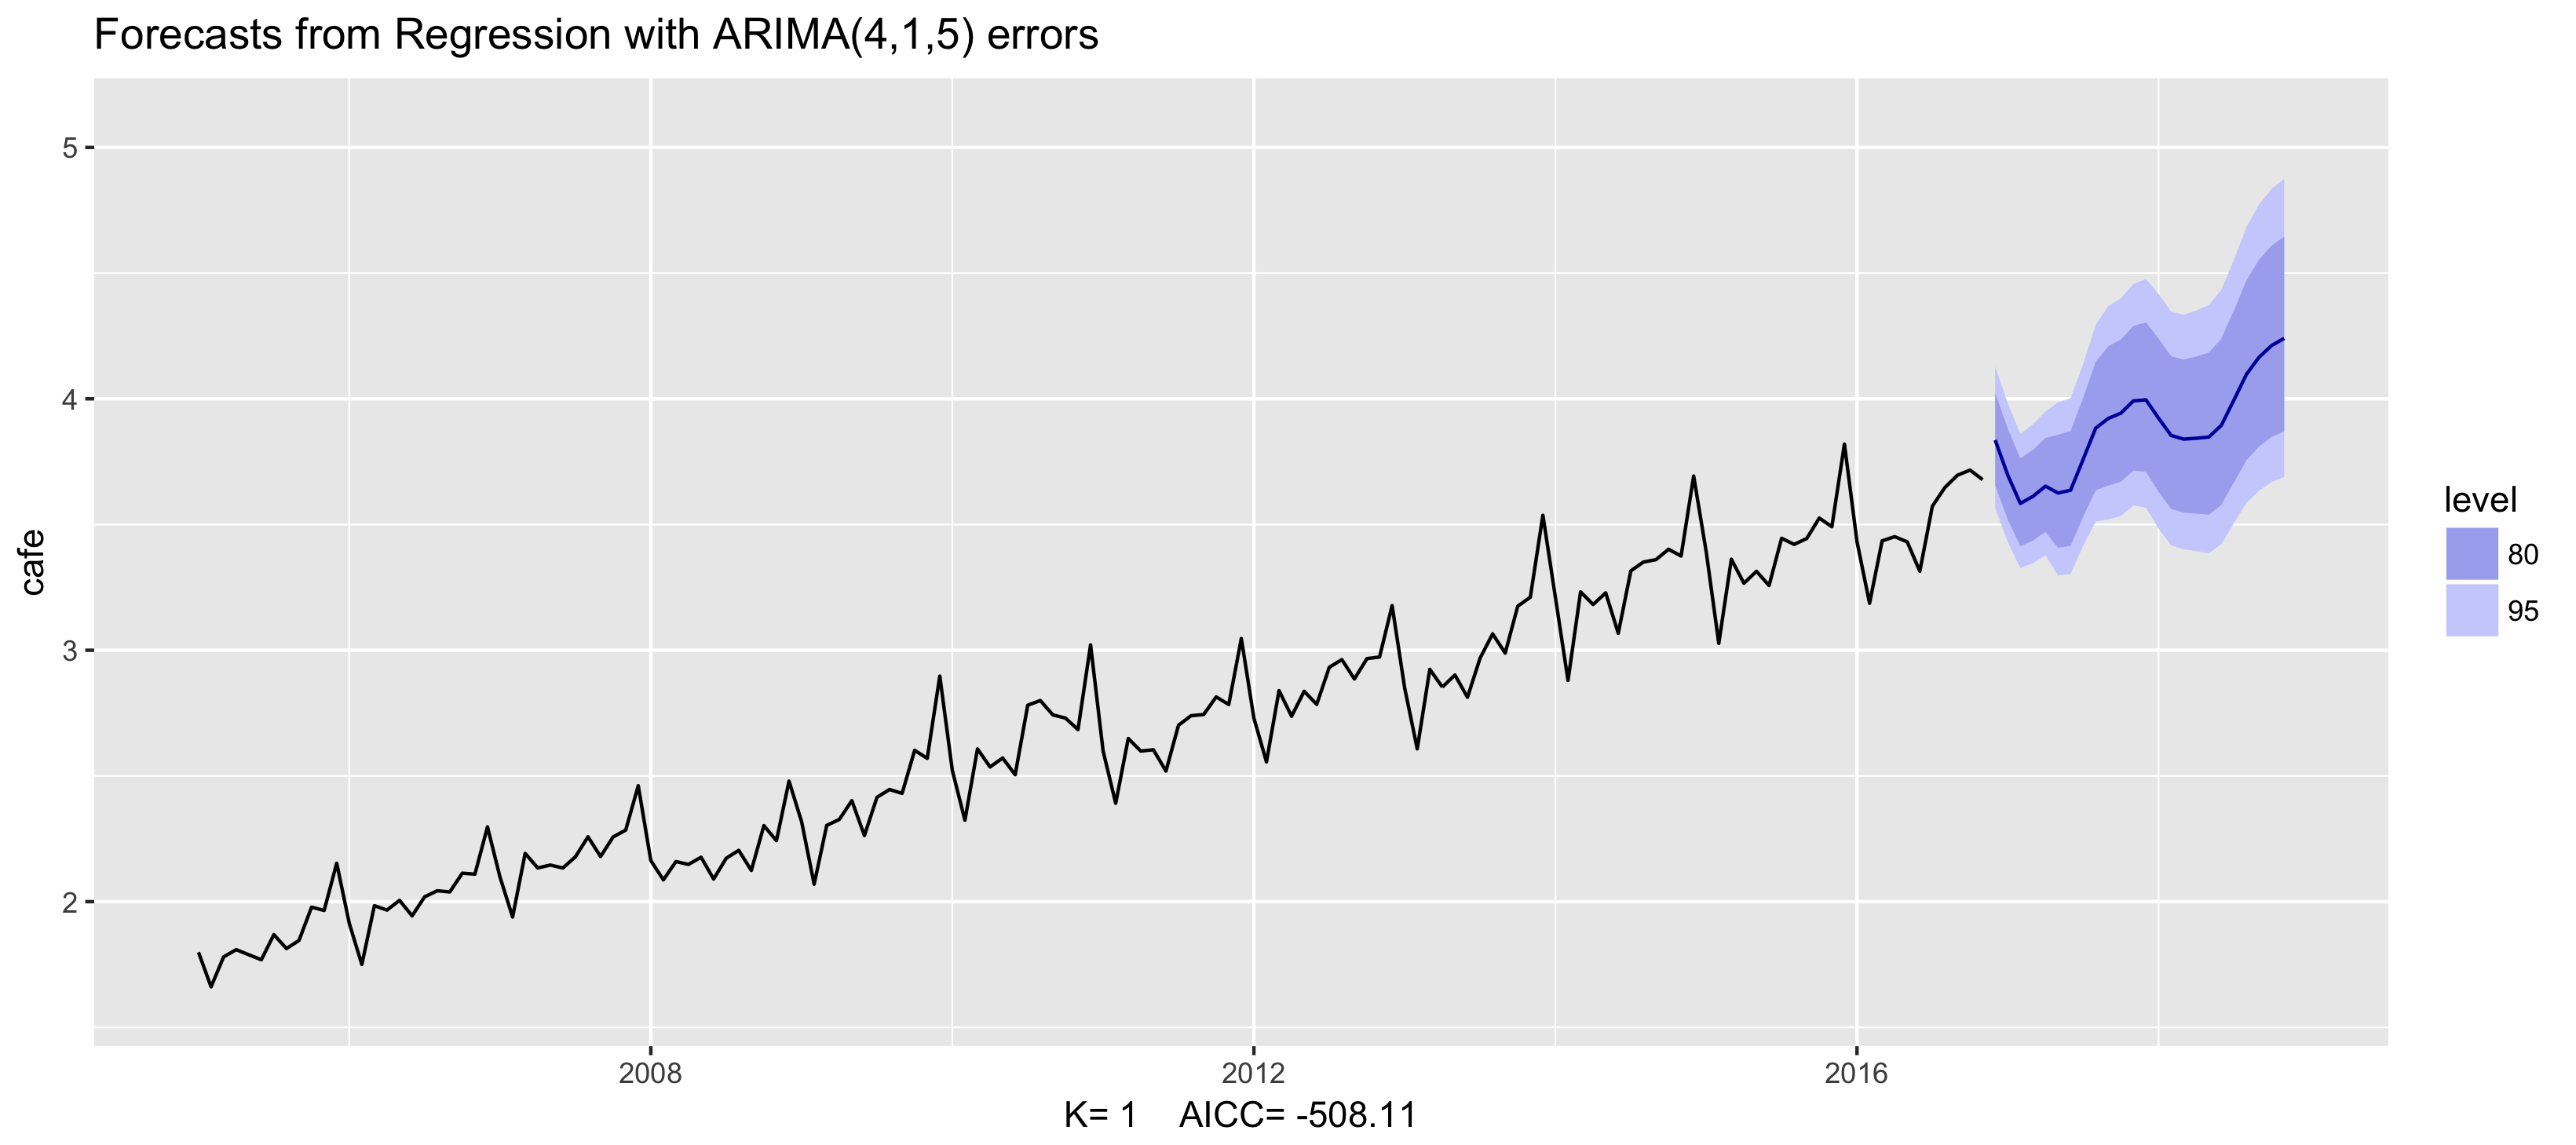
Voorbeeld: Australische cafébestedingen
fit <- auto.arima(cafe, xreg = fourier(cafe, K = 1),
                  seasonal = FALSE, lambda = 0)
fit %>% forecast(xreg = fourier(cafe, K = 1, h = 24)) %>%
   autoplot() + ylim(1.6, 5.1)
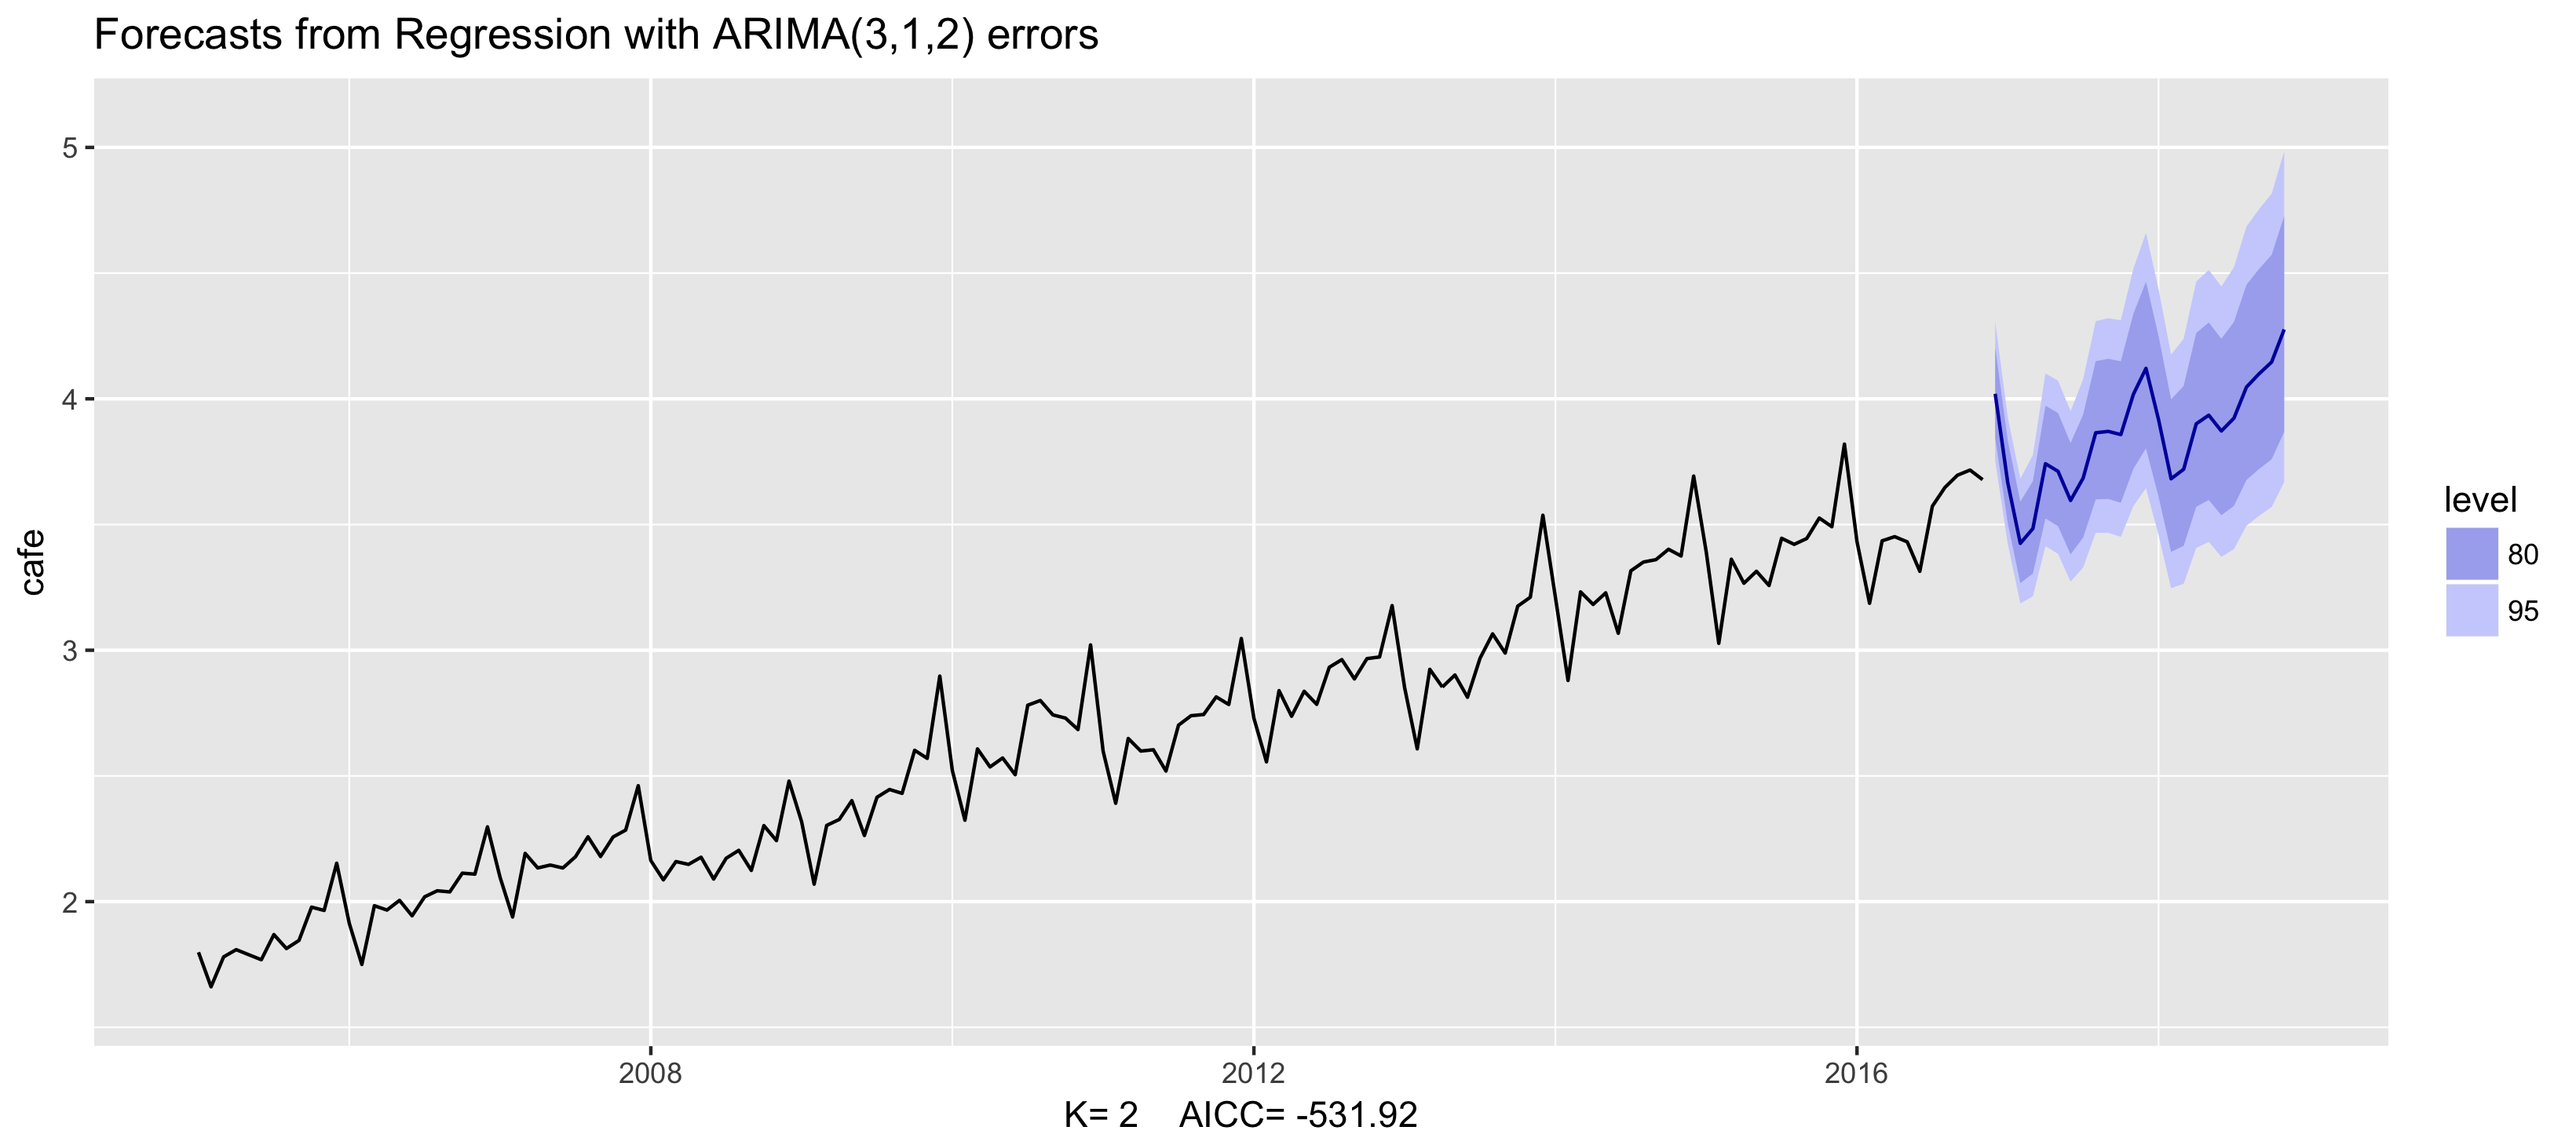
Voorbeeld: Australische cafébestedingen
fit <- auto.arima(cafe, xreg = fourier(cafe, K = 2),
                  seasonal = FALSE, lambda = 0)
fit %>% forecast(xreg = fourier(cafe, K = 2, h = 24)) %>%
   autoplot() + ylim(1.6, 5.1)
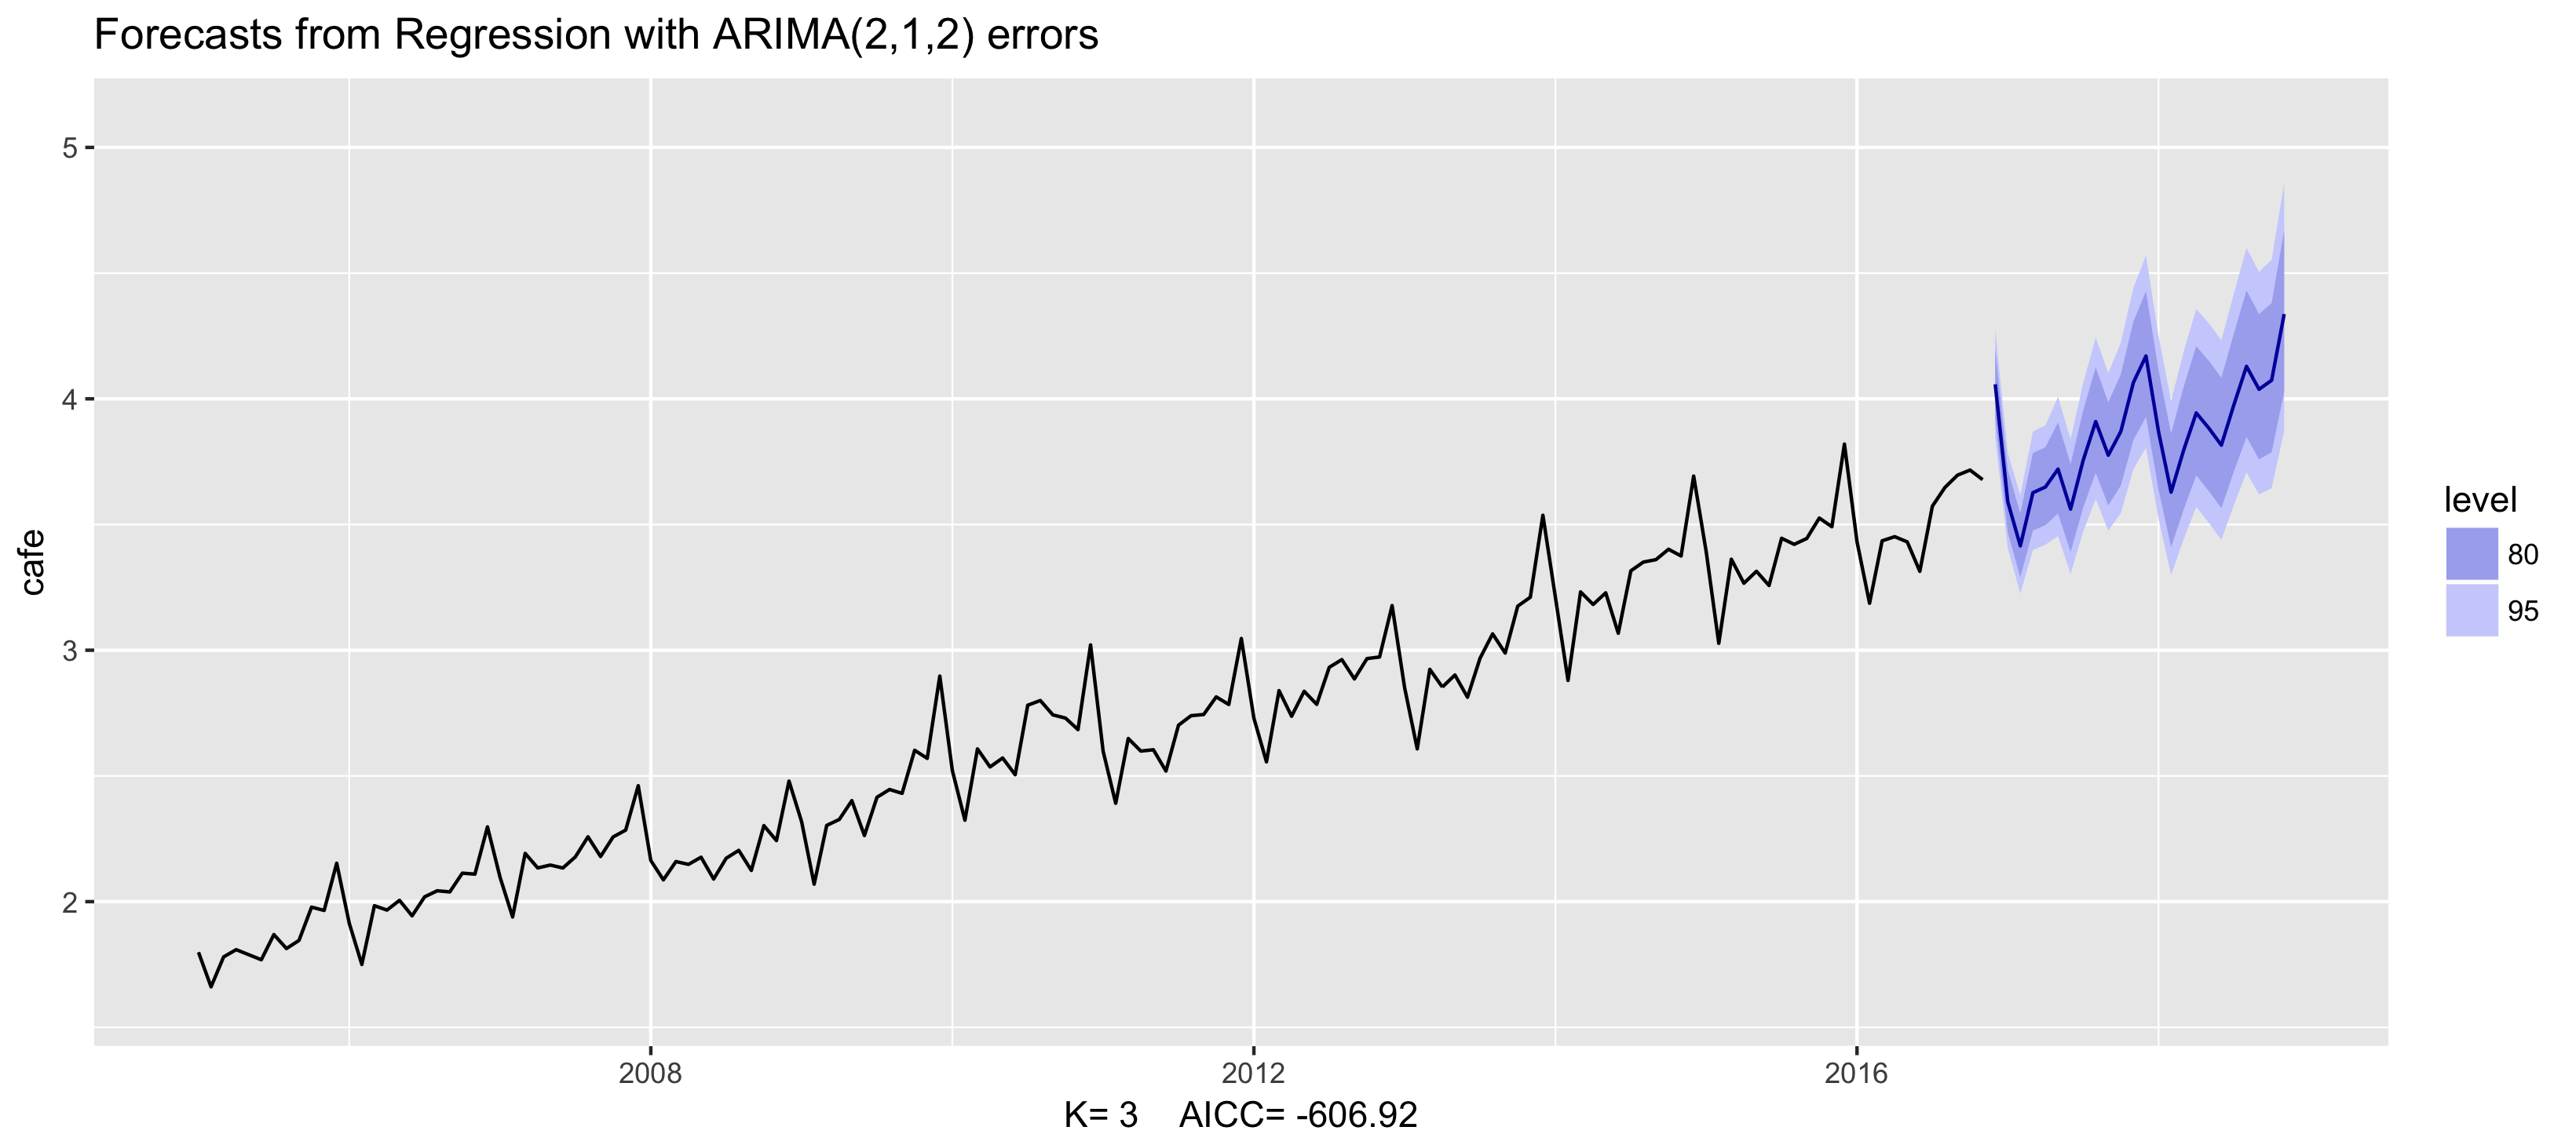
Voorbeeld: Australische cafébestedingen
fit <- auto.arima(cafe, xreg = fourier(cafe, K = 3),
                  seasonal = FALSE, lambda = 0)
fit %>% forecast(xreg = fourier(cafe, K = 3, h = 24)) %>%
   autoplot() + ylim(1.6, 5.1)
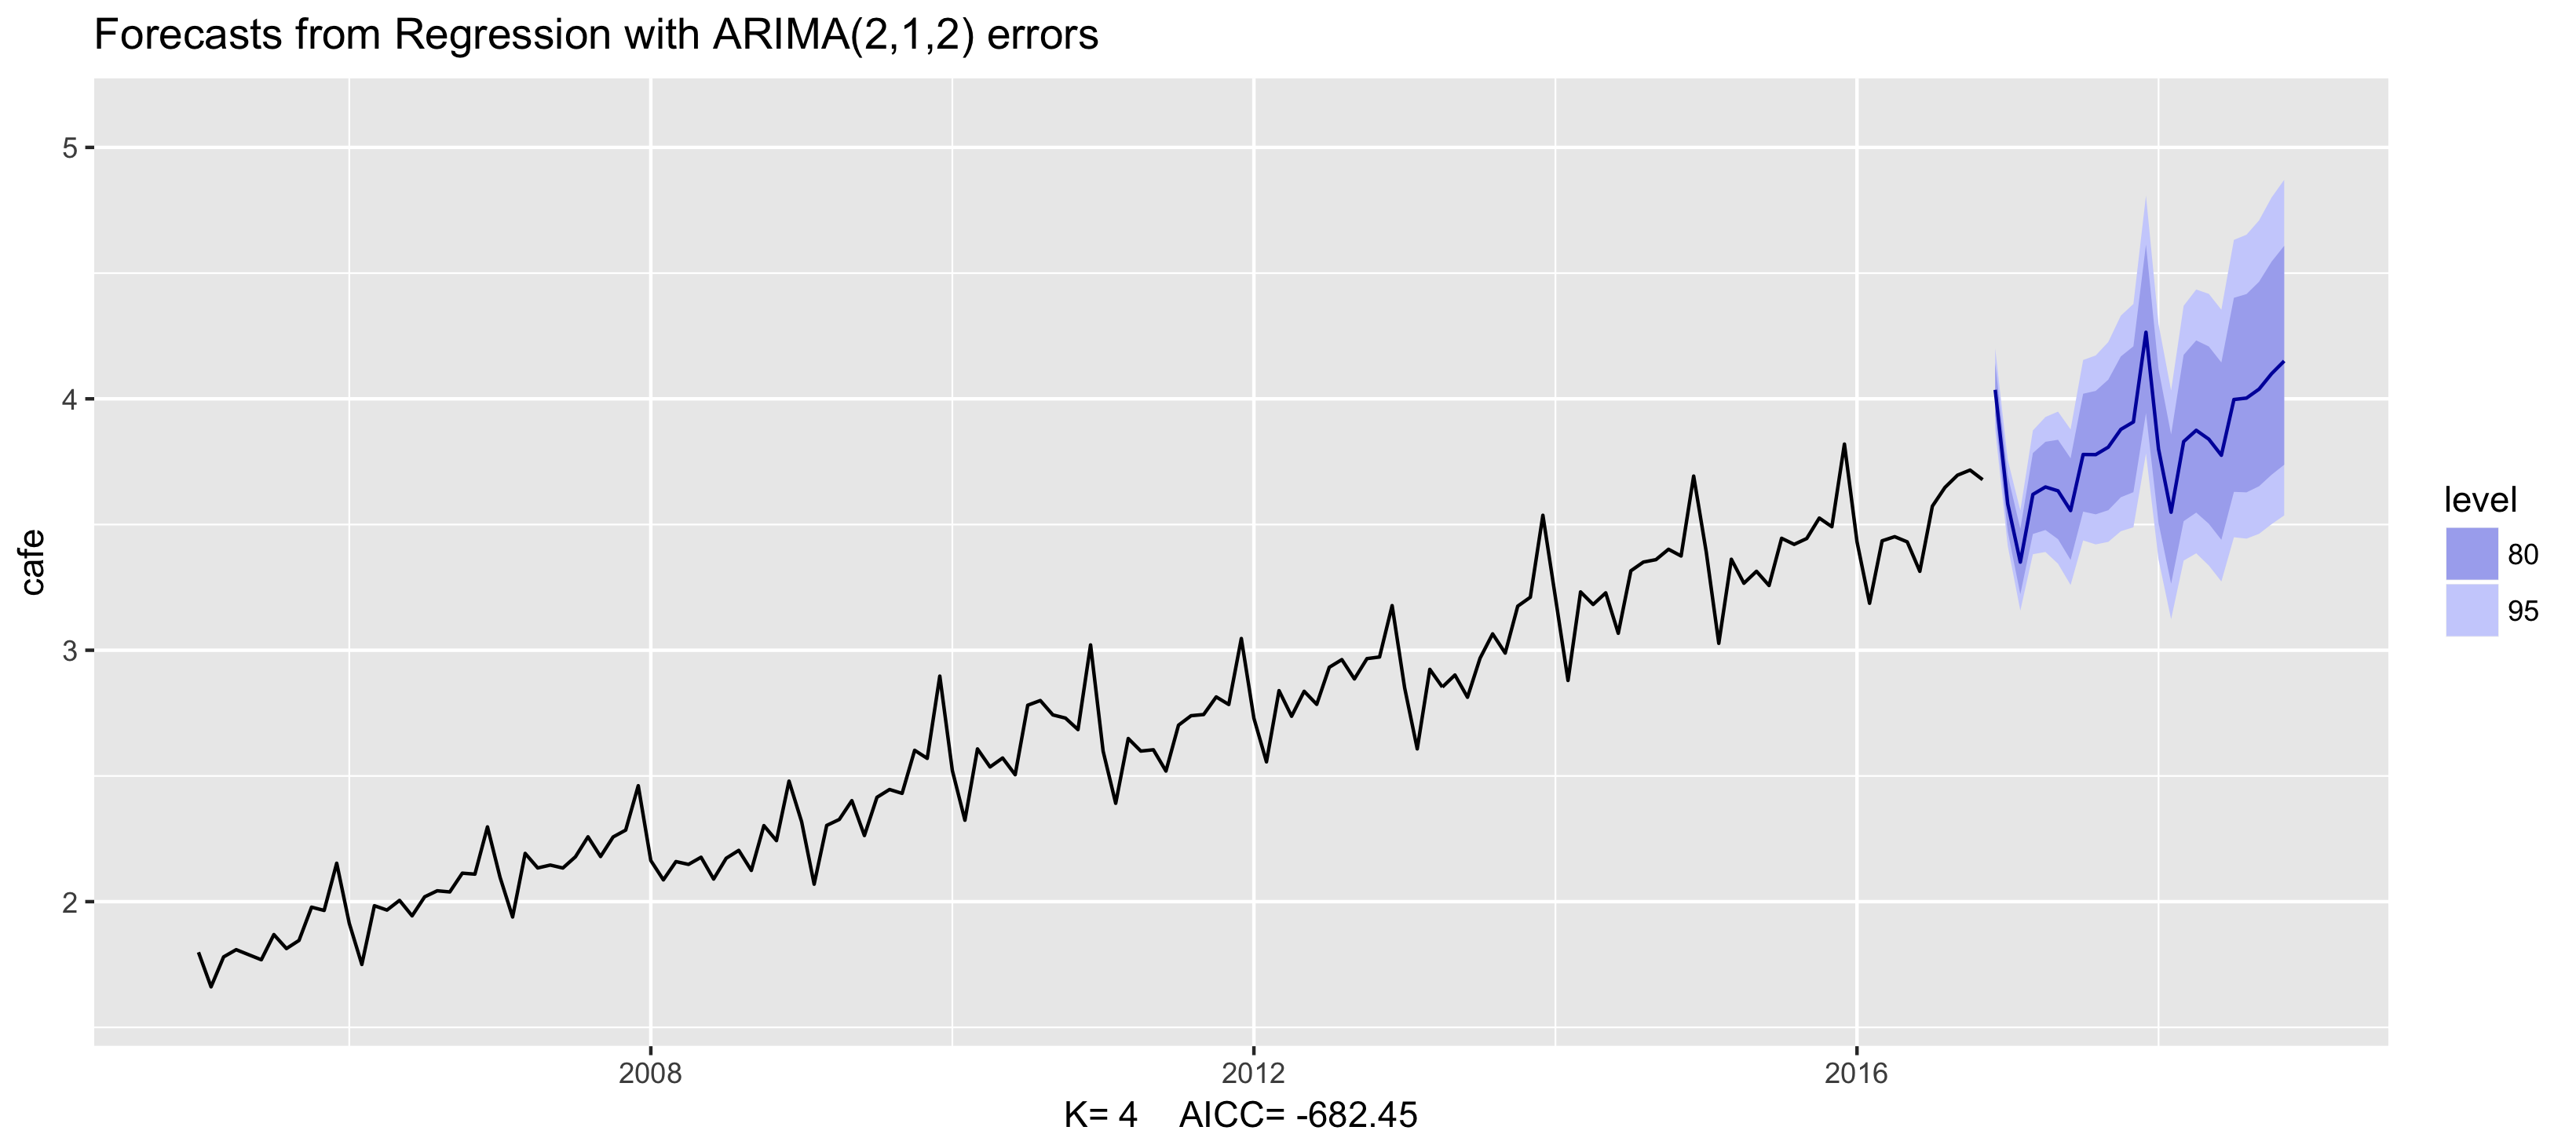
Voorbeeld: Australische cafébestedingen
fit <- auto.arima(cafe, xreg = fourier(cafe, K = 4),
                  seasonal = FALSE, lambda = 0)
fit %>% forecast(xreg = fourier(cafe, K = 4, h = 24)) %>%
   autoplot() + ylim(1.6, 5.1)
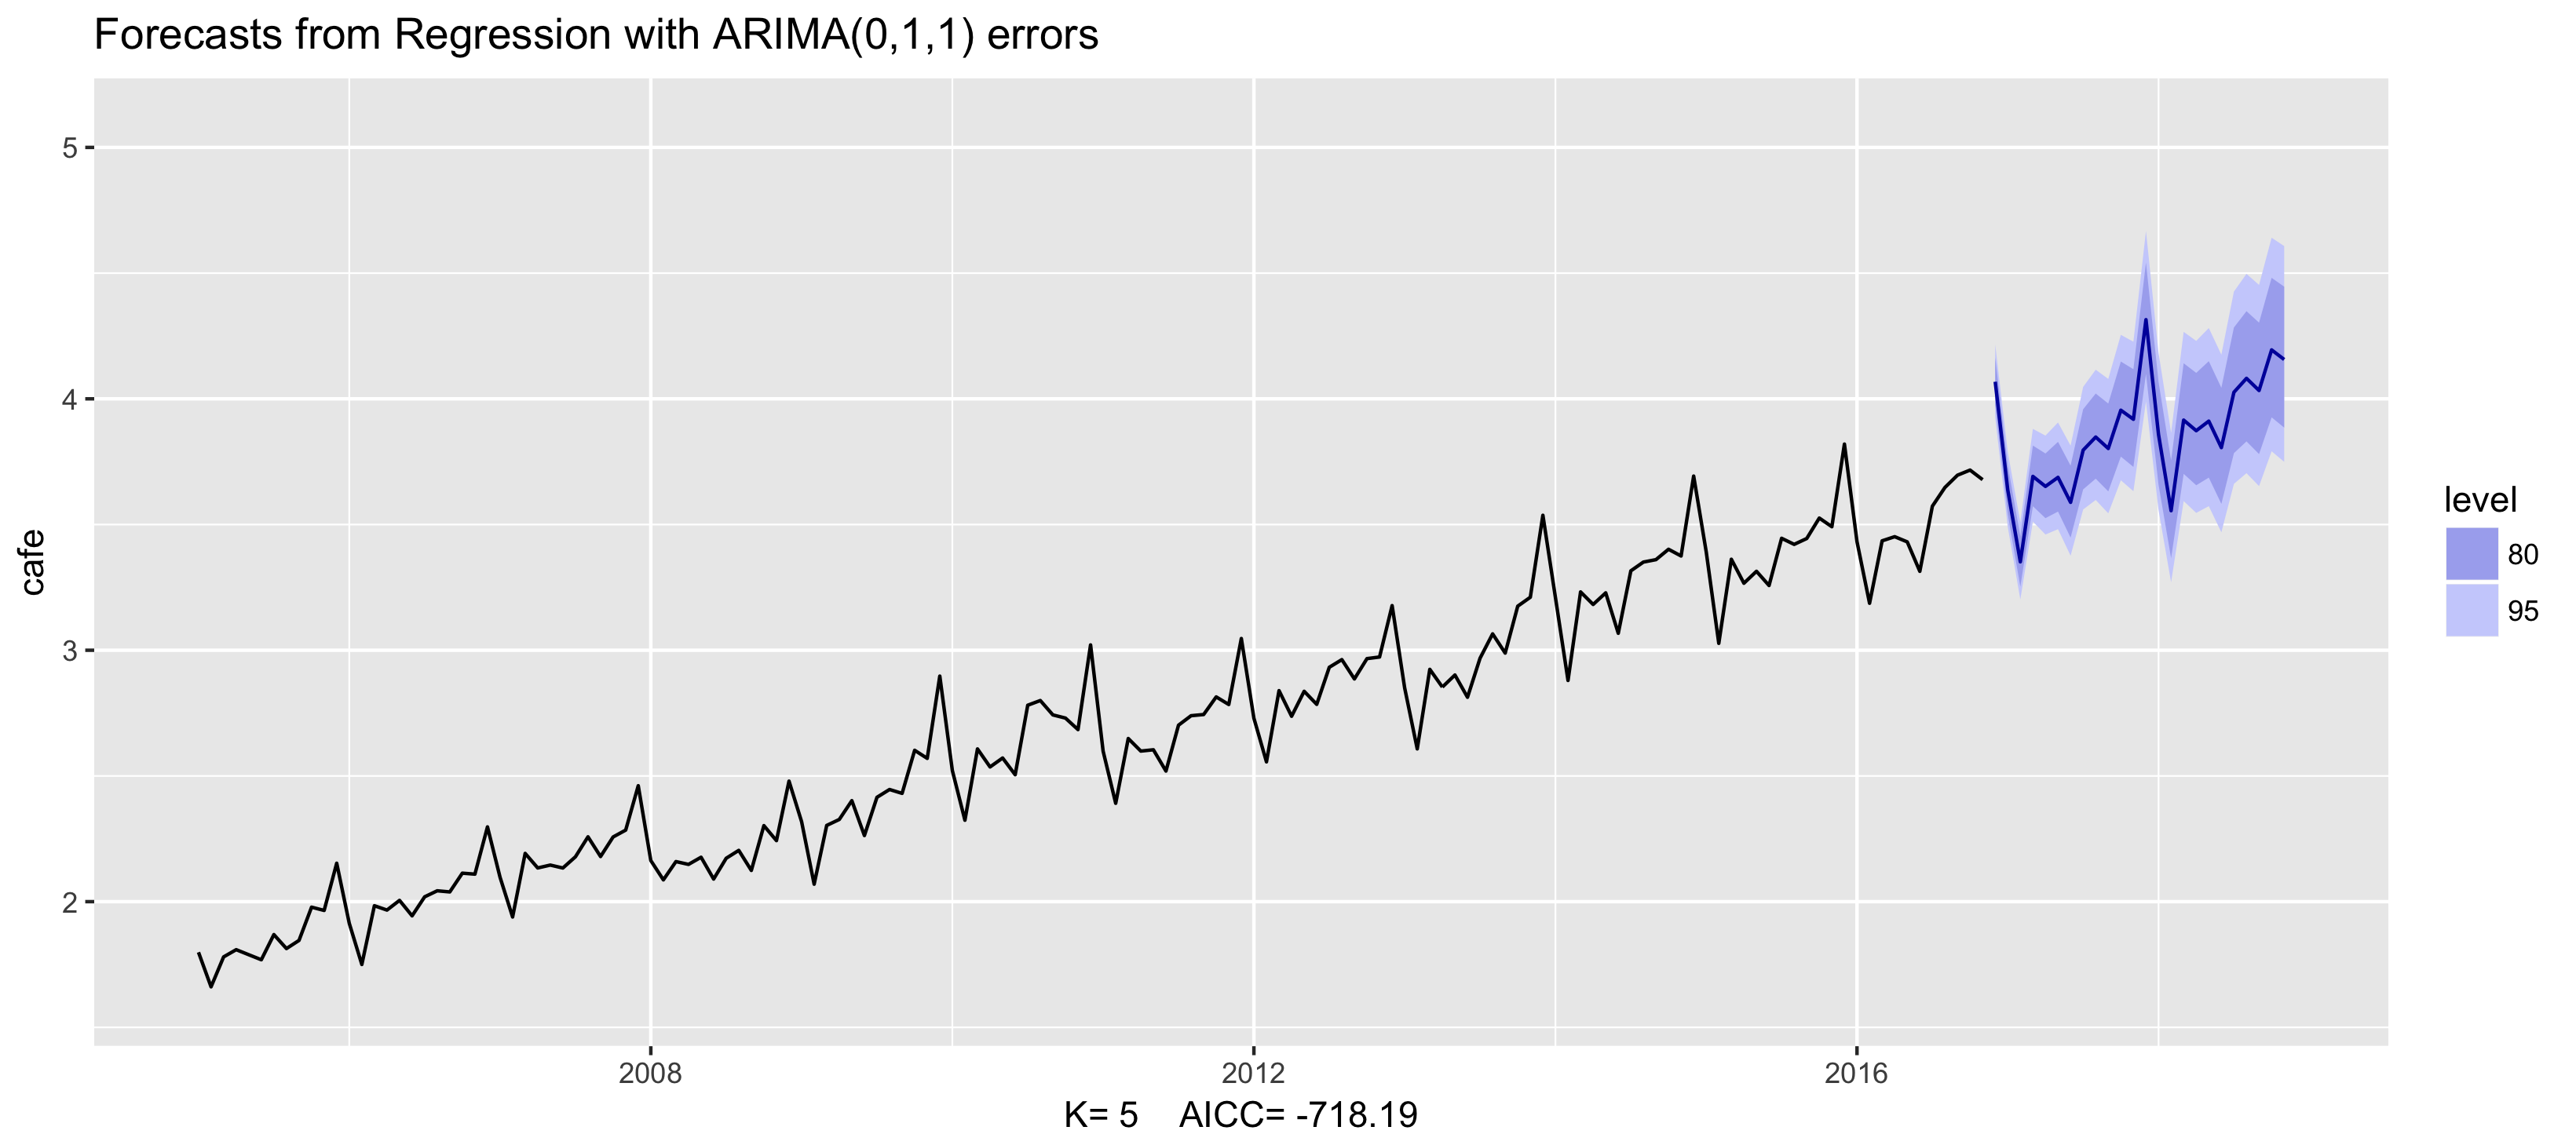
Voorbeeld: Australische cafébestedingen
fit <- auto.arima(cafe, xreg = fourier(cafe, K = 5),
                  seasonal = FALSE, lambda = 0)
fit %>% forecast(xreg = fourier(cafe, K = 5, h = 24)) %>%
   autoplot() + ylim(1.6, 5.1)
Voorbeeld: Australische cafébestedingen
fit <- auto.arima(cafe, xreg = fourier(cafe, K = 6),
                  seasonal = FALSE, lambda = 0)
fit %>% forecast(xreg = fourier(cafe, K = 6, h = 24)) %>%
   autoplot() + ylim(1.6, 5.1)

Dynamische harmonische regressie

- Andere predictoren kun je ook toevoegen: $x_{t,1},...,x_{t,r}$
- Kies K om de $AIC_c$ te minimaliseren
- K mag niet groter zijn dan m/2
- Vooral nuttig voor wekelijkse, dagelijkse en subdagelijkse data

