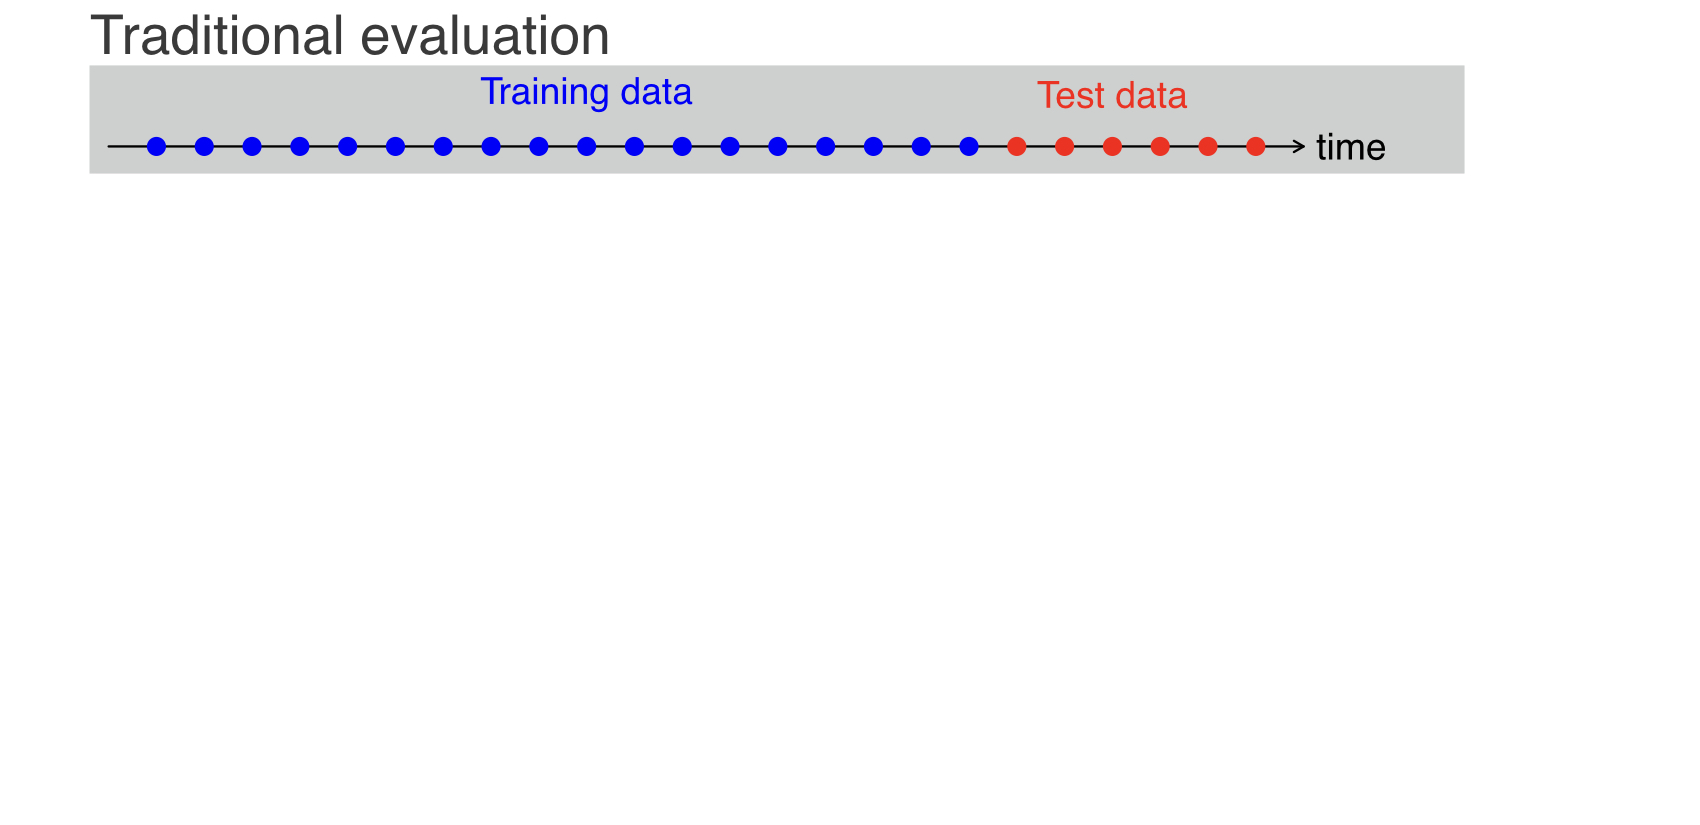
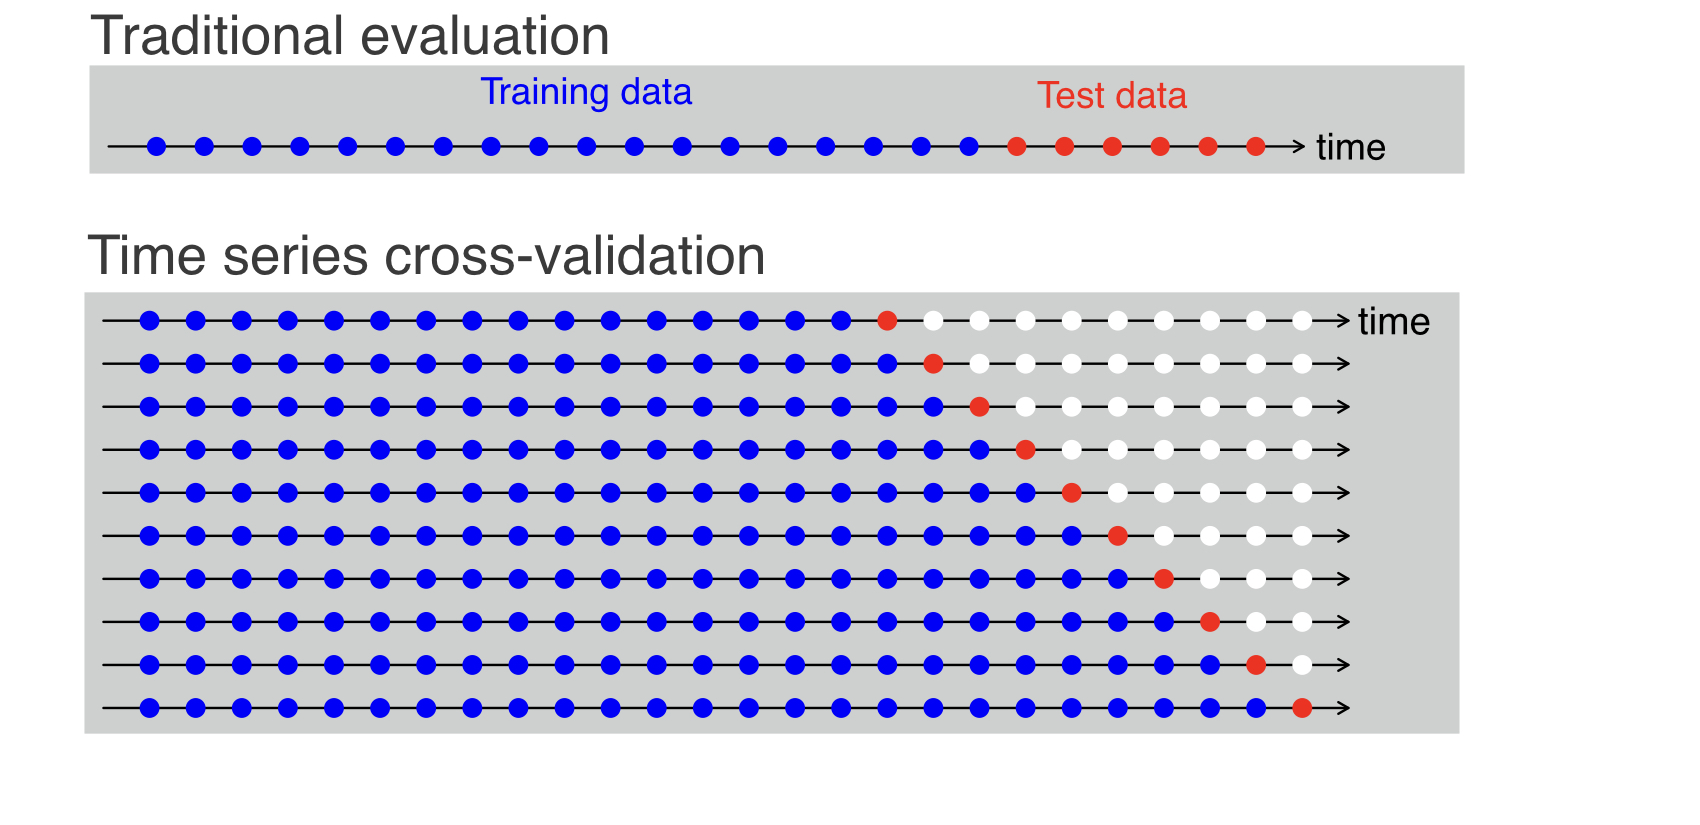
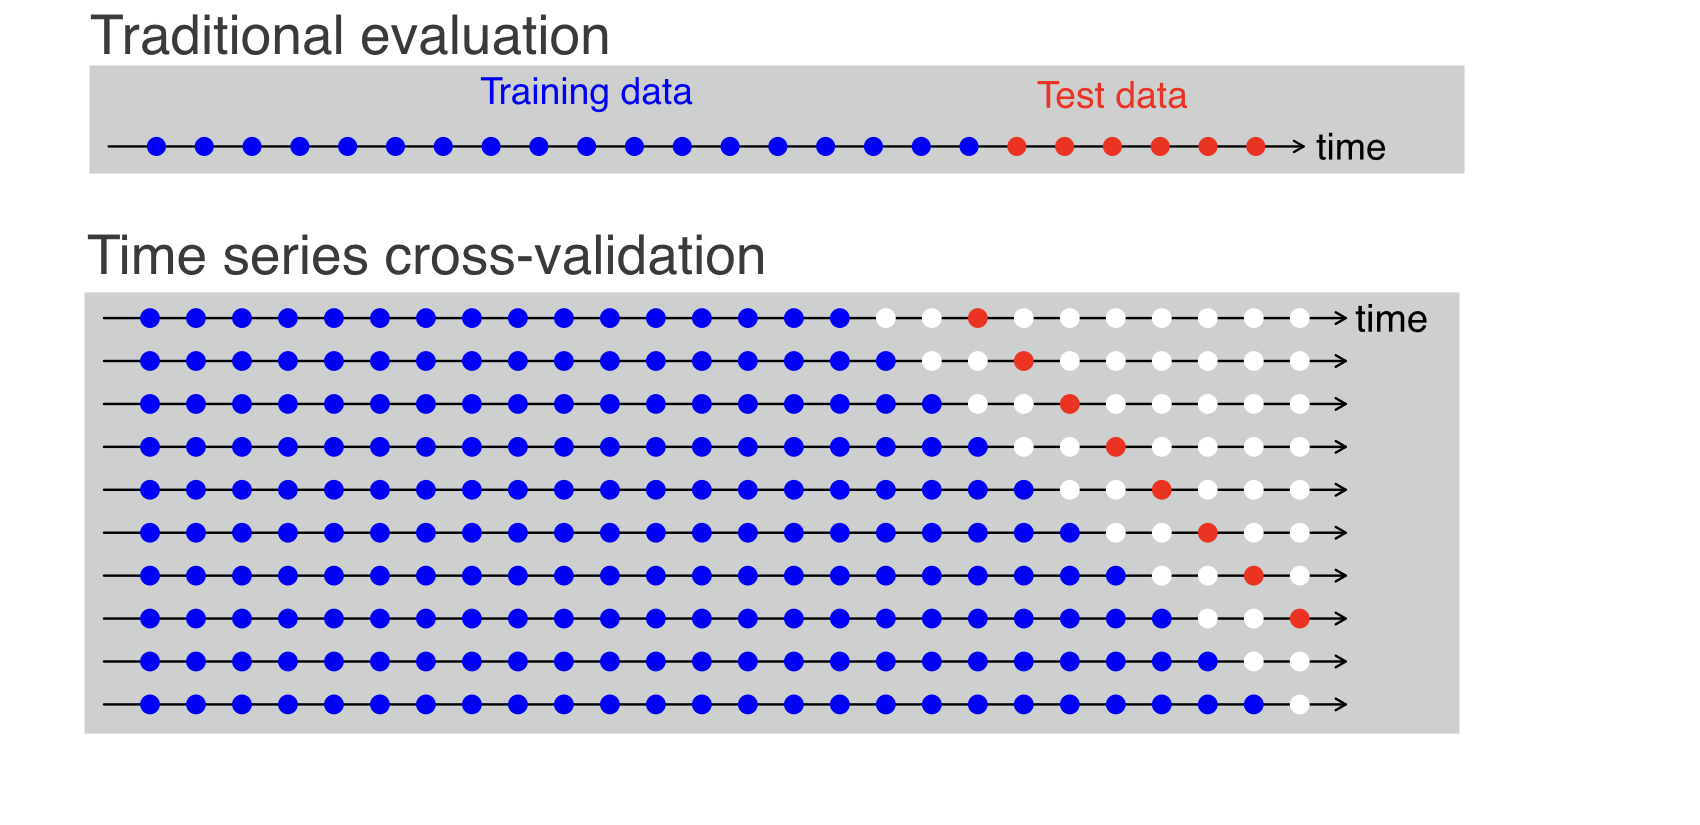
Voorspellen in R
Rob J. Hyndman
Professor of Statistics at Monash University


MSE met tijdreeks-crossvalidatie
e <- tsCV (oil, forecastfunction = naive, h = 1)
mean(e^2 , na.rm = TRUE)
2355.753
Als er geen parameters te schatten zijn, geeft tsCV met h=1 dezelfde waarden als residuen
sq <- function(u){u^2}
tsCV(oil, forecastfunction = naive, h = 10) %>%
sq() %>% colMeans(na.rm=TRUE)
h=1 h=2 h=3 h=4 h=5 h=6
2355.753 5734.838 9842.239 14299.997 18560.887 23264.410
h=7 h=8 h=9 h=10
26932.799 30766.136 32892.200 32986.214
De MSE neemt toe met de voorspellingshorizon
Voorspellen in R