De randomisatieverdeling gebruiken
Basis van inferentie in R

Jo Hardin
Instructor
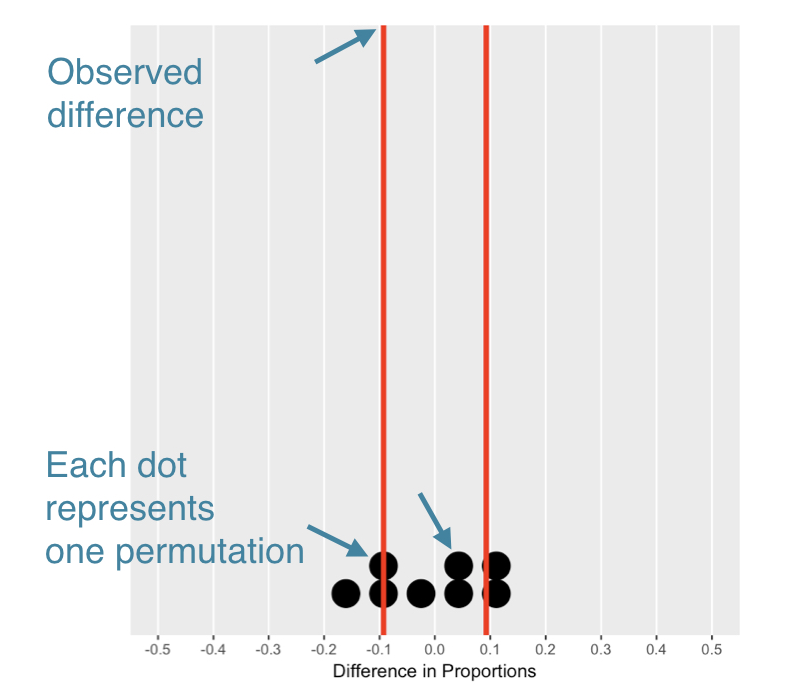
De nulverdeling begrijpen
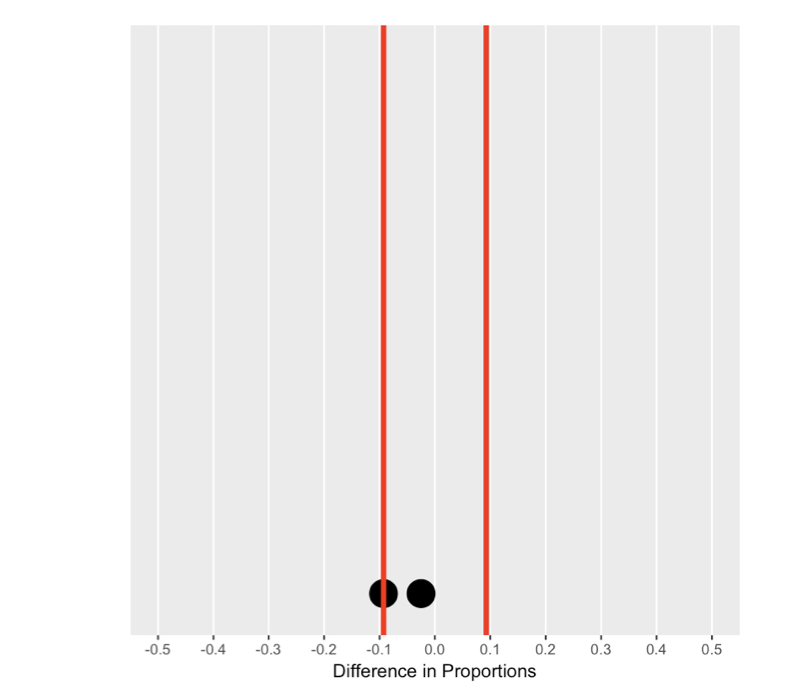
De nulverdeling begrijpen
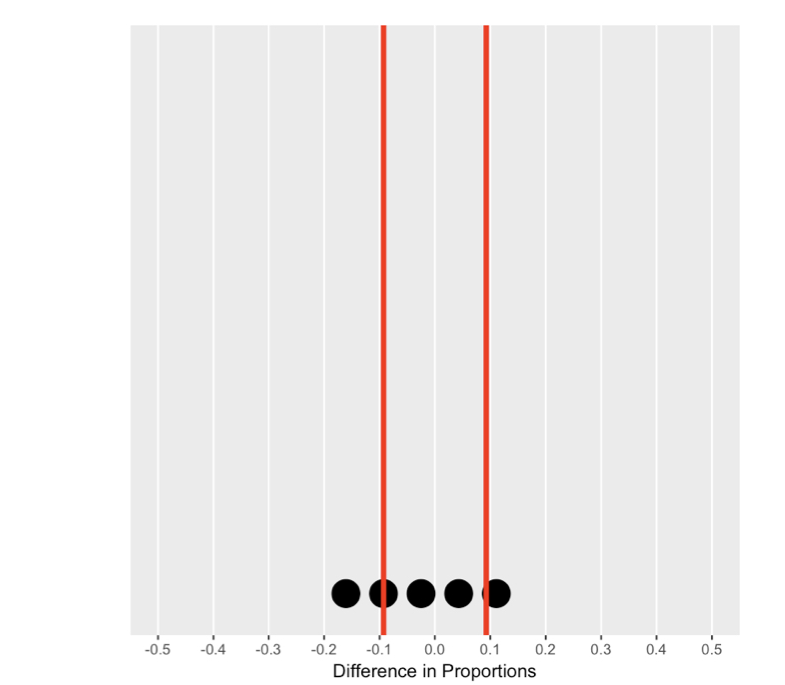
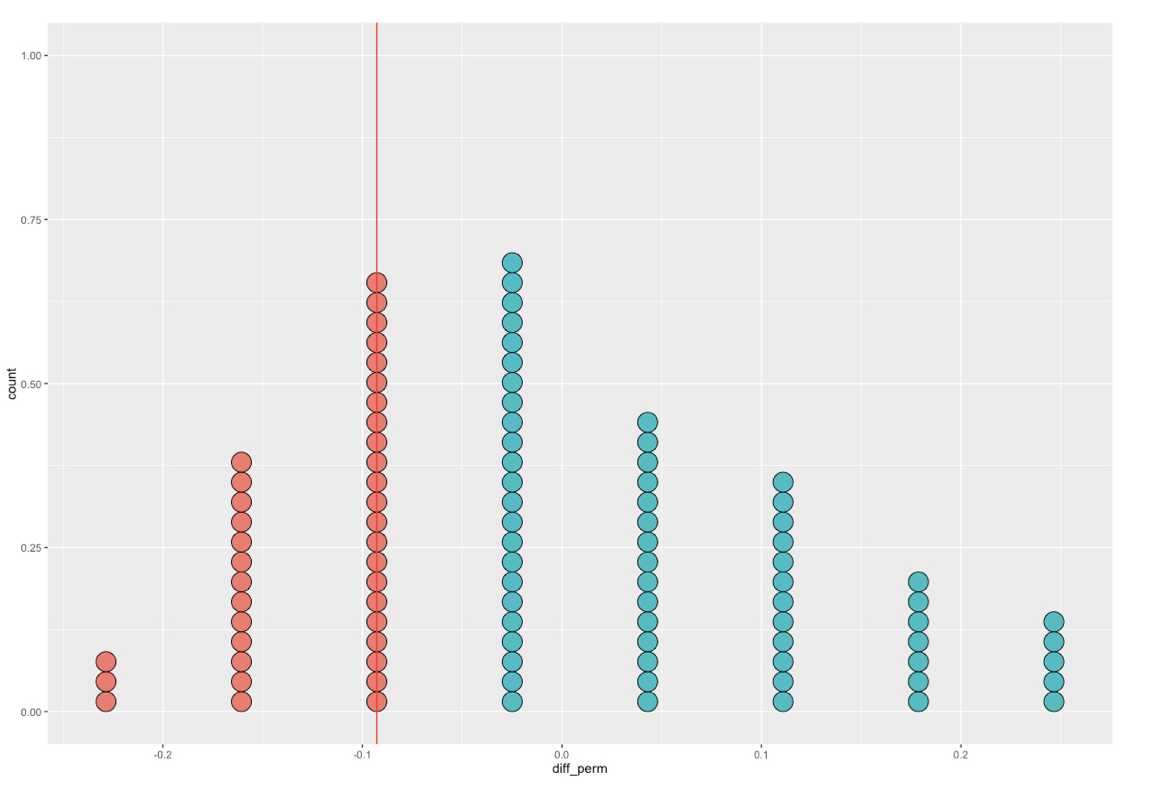
De nulverdeling begrijpen
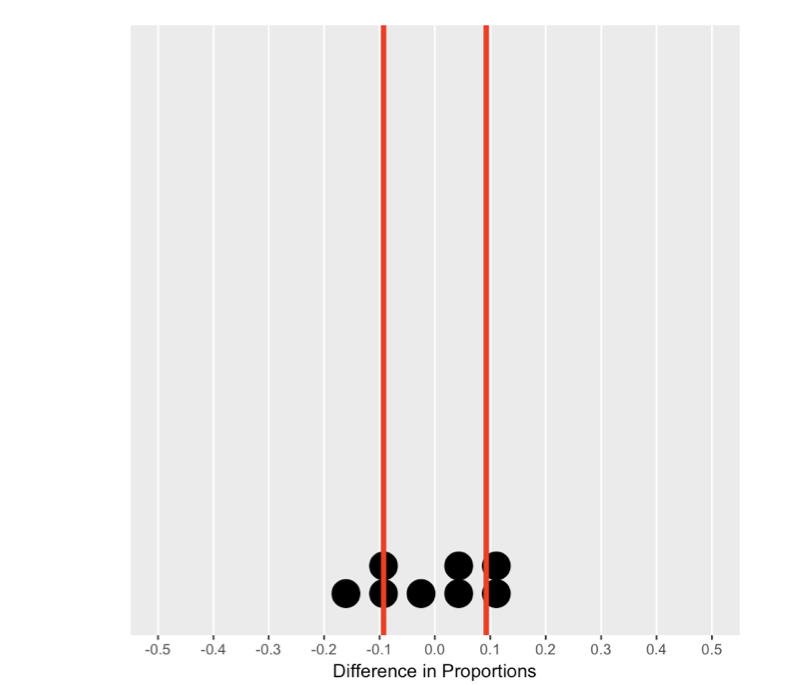
De nulverdeling begrijpen
De nulverdeling begrijpen
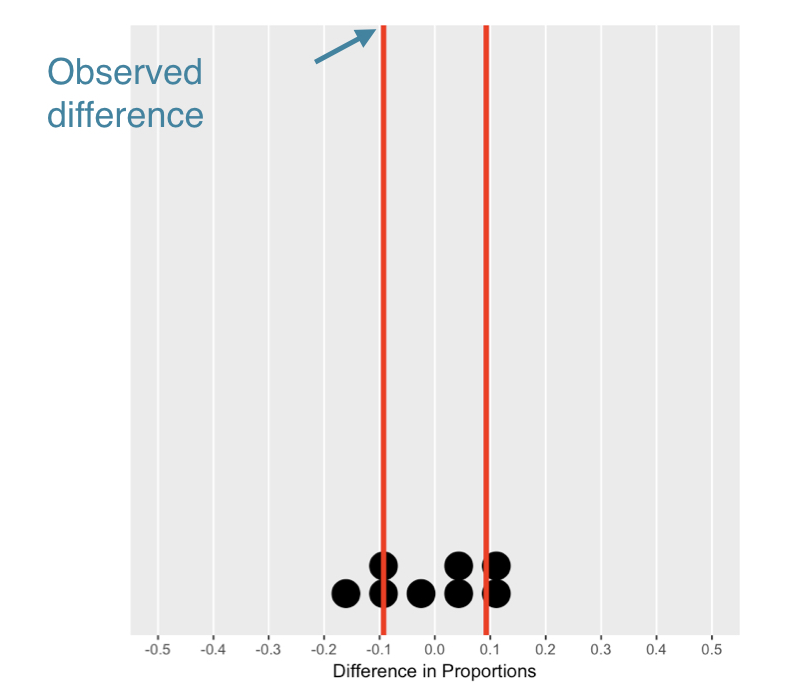
Significantie
Basis van inferentie in R
Jo Hardin
Instructor

