Wat is een choropleth?

Geospatiale data visualiseren in Python

Mary van Valkenburg

Data Science Program Manager, Nashville Software School

Definitie van een choropleth
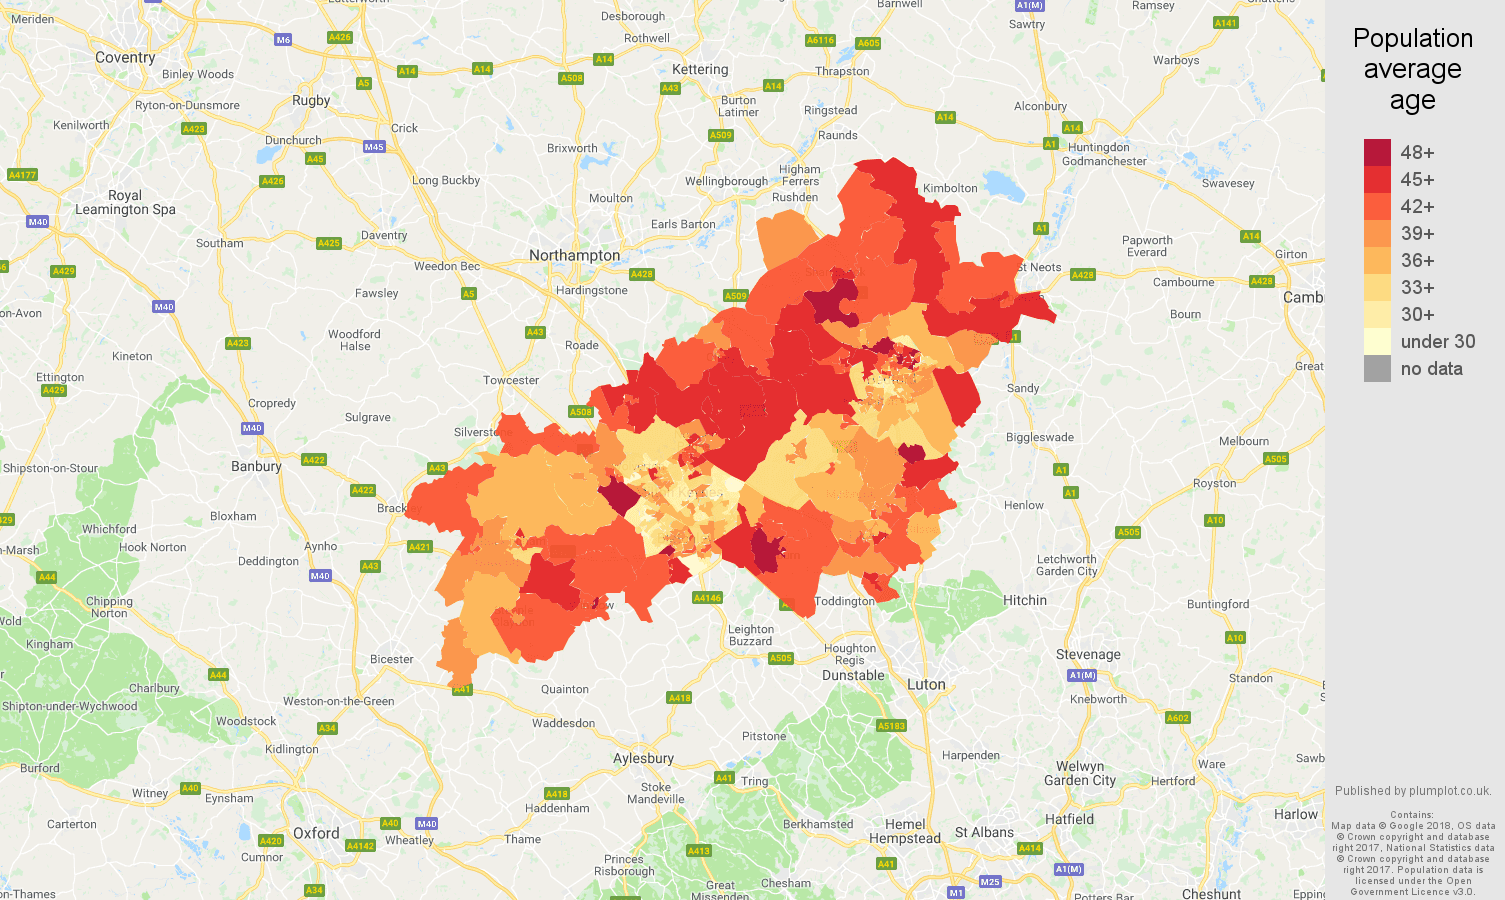
choropleth van gemiddelde leeftijd van bewoners voor LSOA’s in Milton Keynes

Geospatiale data visualiseren in Python

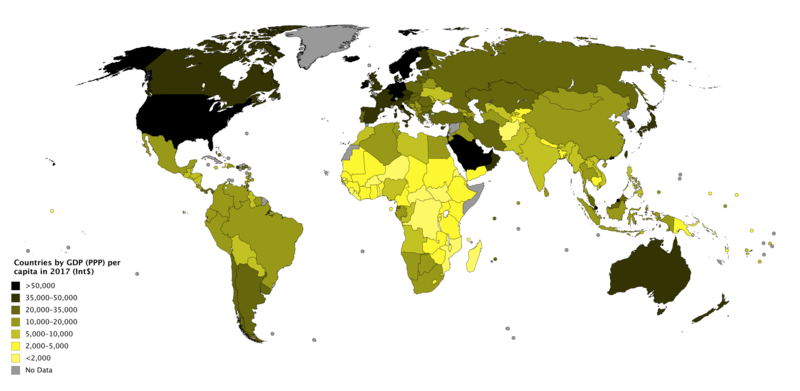
choropleth van bbp per hoofd (PPP) wereldwijd

Geospatiale data visualiseren in Python

Dichtheid

schools_in_districts.head(2)
district  geometry                  name               lat    lng
1         (POLYGON ((-86.77 36.38... Nashville Prep    36.16 -86.85
1         (POLYGON ((-86.77 36.38... Rocketship Prep   36.17 -86.79
Geospatiale data visualiseren in Python

Aantallen ophalen

school_counts = schools_in_districts.groupby(['district']).size()
print(school_counts)
district
1    30
2    11
3    19
4    18
5    36
6    21
7    13
8    10
9    12
dtype: int64
Geospatiale data visualiseren in Python

Aantallen toevoegen

school_counts_df = school_counts.to_frame()
school_counts_df = school_counts_df.reset_index()
school_counts_df.columns = ['district', 'school_count']
districts_with_counts = pd.merge(school_districts, school_counts_df, 
                                 on = 'district')
districts_with_counts.head(2)
district geometry           school_count
1        (POLYGON ((-86.77 36.38...  30
3        (POLYGON ((-86.75 36.40...  19
Geospatiale data visualiseren in Python

Deel aantallen door oppervlaktes

districts_with_counts['area'] = districts_with_counts.area
districts_with_counts['school_density'] = districts_with_counts.apply(
    lambda row: row.school_count/row.area, axis = 1)

districts_with_counts.head(2)
district geometry           school_count   area    school_density
1        (POLYGON ((-86.77 36.38...    30    0.036641    818.745403
3        (POLYGON ((-86.75 36.40...    19    0.014205    1337.594495
Geospatiale data visualiseren in Python

Laten we oefenen!

Geospatiale data visualiseren in Python

Preparing Video For Download...