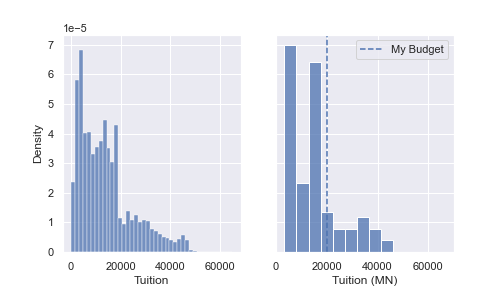
Aanpassen met matplotlib
Gevorderde datavisualisatie met Seaborn

Chris Moffitt
Instructor
Matplotlib Axes
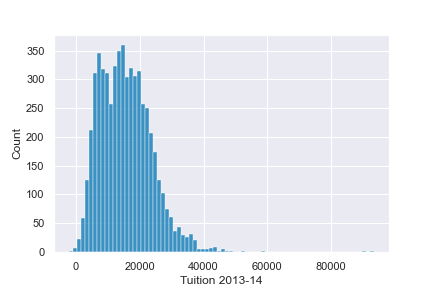
- De meeste aanpassingen gaan via
matplotlib-Axes-objecten - Je kunt
Axesdoorgeven aan seaborn-functies
fig, ax = plt.subplots()
sns.histplot(df['Tuition'], ax=ax)
ax.set(xlabel='Tuition 2013-14')
Meer aanpassen
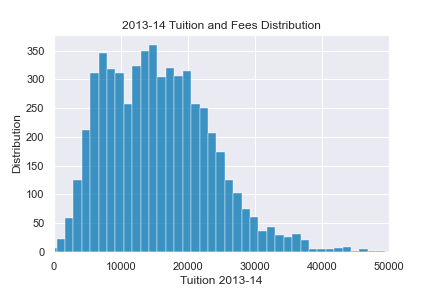
- Het
axes-object ondersteunt veel gangbare aanpassingen
fig, ax = plt.subplots()
sns.histplot(df['Tuition'], ax=ax)
ax.set(xlabel="Tuition 2013-14",
       ylabel="Verdeling", xlim=(0, 50000),
title="2013-14 verdeling van collegegeld en kosten")
Plots combineren