Outlier-robuuste feature-scaling

Anomaly Detection in Python

Bekhruz (Bex) Tuychiev

Kaggle Master, Data Science Content Creator

Euclidische afstand
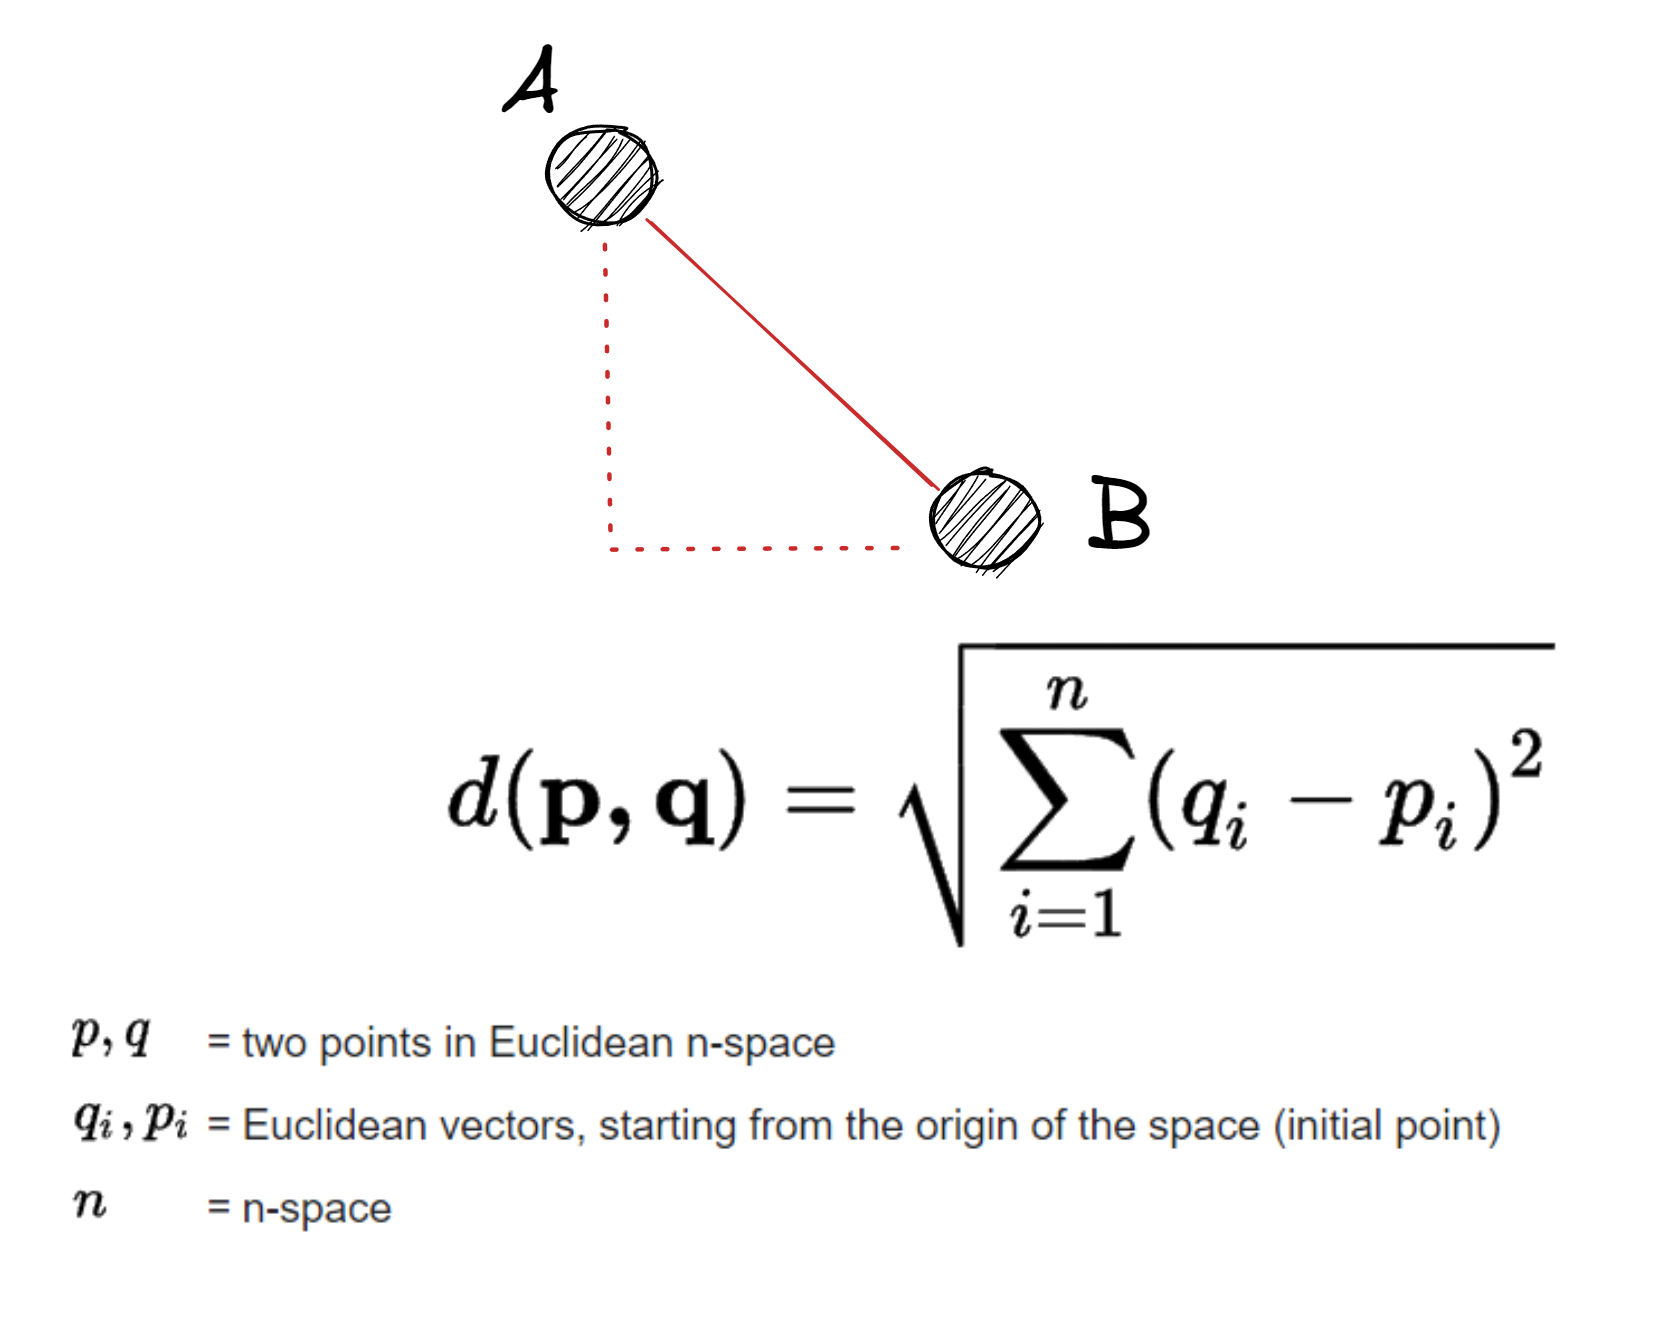
A = np.array([9, 1, 6])
B = np.array([25, 44, 85])


diffs = (B - A) ** 2
dist_AB = np.sqrt(np.sum(diffs)) print(dist_AB)
91.35644476444998

De formule voor euclidische afstand met een illustratie.

Anomaly Detection in Python

Euclidisch in SciPy

from scipy.spatial.distance import \
euclidean

dist_AB = euclidean(A, B)
dist_AB
91.35644476444998

De formule voor euclidische afstand met een illustratie.

Anomaly Detection in Python

Standaardisatie

  • Gemiddelde aftrekken en delen door de std
  • Resultaat: gemiddelde 0 en std 1
Anomaly Detection in Python

StandardScaler

from sklearn.preprocessing import StandardScaler

ss = StandardScaler()

# Feature en target ophalen X = males.drop("weightkg", axis=1) y = males[['weightkg']]
# Fitten ss.fit(X)
Anomaly Detection in Python

Transformeren

X_transformed = ss.transform(X)

X_transformed[:5]
array([[-1.05174523],
       [-0.29289108],
       [ 1.3446363 ],
       [-1.21654894],
       [0.056451235]])
Anomaly Detection in Python

fit_transform

ss = StandardScaler()

X_transformed = ss.fit_transform(X)
Anomaly Detection in Python

QuantileTransformer

from sklearn.preprocessing import QuantileTransformer


# Init qt = QuantileTransformer() X = males.drop("weightkg", axis=1) y = males[['weightkg']]
X_transformed = qt.fit_transform(X) X_transformed.shape
(4082, 94)
Anomaly Detection in Python

Kolomnamen behouden

qt = QuantileTransformer()

X.loc[:, :] = qt.fit_transform(X)

X.head()

De eerste vijf rijen van een getransformeerde versie van de Ansur Males-lichaamsmetingen.

Anomaly Detection in Python

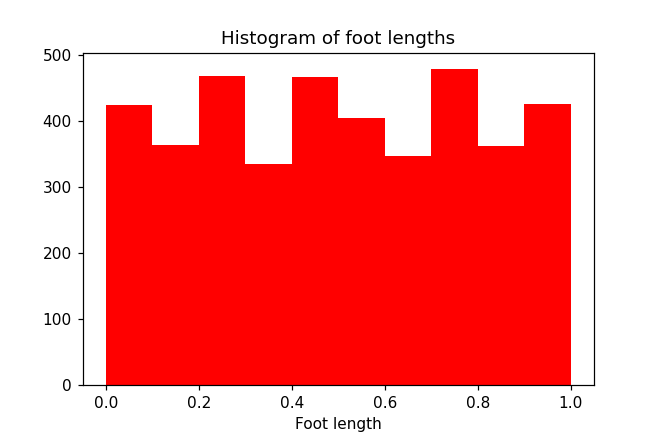
Uniform histogram

plt.hist(X['footlength'], color='red')

plt.xlabel("Foot length")
plt.title("Histogram of foot lengths")

plt.show()

Een histogram van de kolom voetlengte met een uniforme verdeling

Anomaly Detection in Python

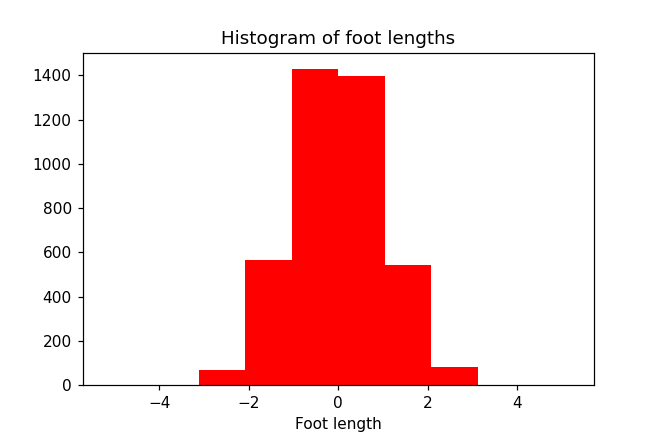
Normaal histogram

qt = QuantileTransformer(
  output_distribution='normal')

# Rebuild the overridden feature array
X = males.drop("weightkg", axis=1)
X.loc[:, :] = qt.fit_transform(X)

plt.hist(X['footlength'], color='r')
plt.xlabel("Foot length")
plt.title("Histogram of foot lengths")

plt.show()

Een histogram van de kolom voetlengte met een vrijwel normale verdeling

Anomaly Detection in Python

Laten we oefenen!

Anomaly Detection in Python

Preparing Video For Download...